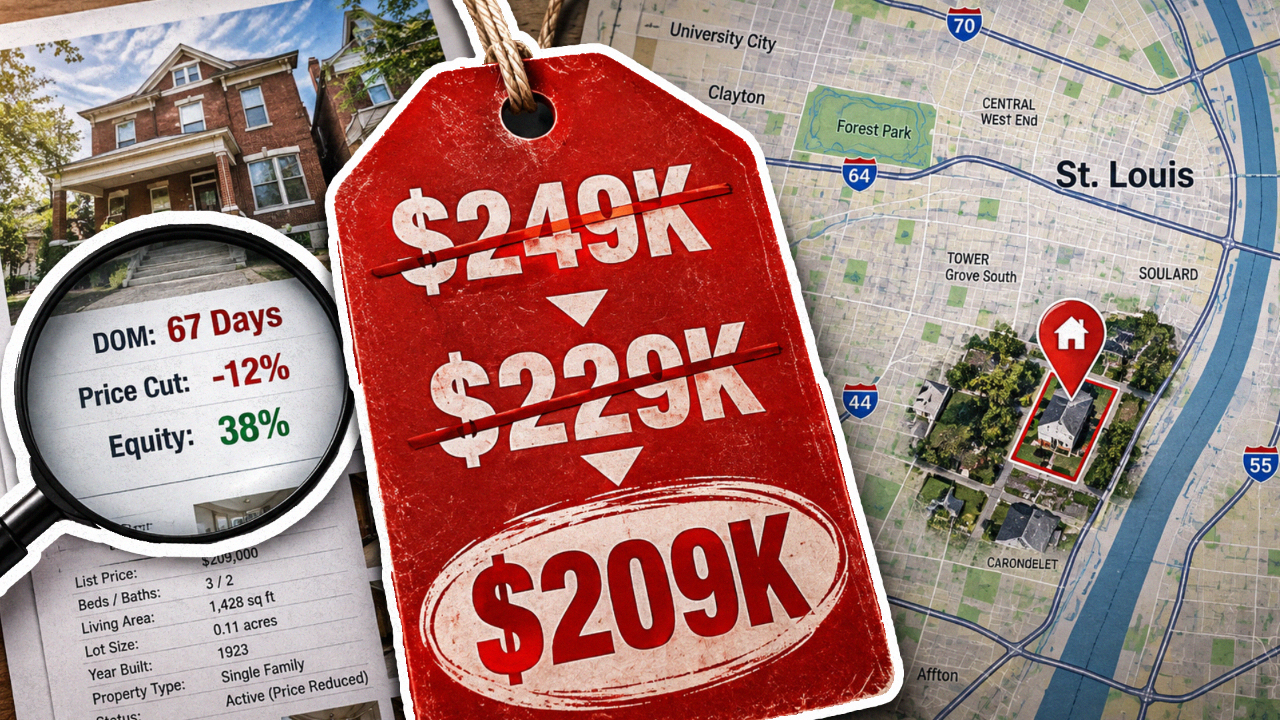
St. Louis’ Best Buying Window: Fall 2026 Investor Plan
Sep 19, 2026
St. Louis' Best Buying Window Is Almost Here: A Fall 2026 Investor Game Plan
If you buy or sell real estate in St. Louis, you've probably already caught wind of the report making the rounds this month: Realtor.com says there's a specific stretch of the calendar where local buyers tend to get the best combination of inventory, price, and negotiating room. For the St. Louis, MO-IL metro, that window lands the week of October 25 through 31, 2026. That's not a typo, and it's not the same week the rest of the country is circling on the calendar — St. Louis runs about a month behind the national curve, and there's a reason for that.
It's a timely report, too, because it's landing on top of a local market that's already been quietly shifting all year. Anyone who's been watching St. Louis listings knows inventory has been climbing since late winter, price cuts have gotten more common, and mortgage rates have been anything but stable. None of that means the market has flipped upside down — it means the leverage has been drifting, degree by degree, toward buyers who know how to work it. A "best week" on the calendar is just the moment when that drift is historically most pronounced.
But before anyone gets too excited about a magic week where houses go on sale, it's worth saying plainly: a "best buying week" is a statistical pattern, not a guarantee. It doesn't mean every property gets marked down. It doesn't mean prices are falling. And it definitely doesn't mean the smart move is to sit on your hands until the last week of October and then start working. Here's what the data actually says, what it means for investors working the St. Louis market specifically, and how to spend the next six weeks so you're not scrambling when the window opens.
Two Dates, Two Very Different Markets
Nationally, Realtor.com's 2026 Best Time to Buy report points to the week of September 27 through October 3 as the strongest window for buyers across the 50 largest U.S. metros, with as much as 32% more active inventory than the start of the year and potential savings in the neighborhood of $14,000 off a median-priced home compared to the summer peak. It's a genuinely useful national signal, but real estate is local, and Realtor.com's own researchers are careful to note that the ideal week shifts by metro, driven by regional patterns like school calendars and local buyer behavior.
St. Louis is one of the metros that lags the national date. Instead of late September, the local sweet spot arrives closer to Halloween — October 25–31 — which tracks with a market that tends to cool off a little later into fall than coastal or Sun Belt metros. Here's the full breakdown of what that week has historically looked like for the St. Louis, MO-IL metro, compared to an average week the rest of the year:
|
Metric |
Best Week Change |
|---|---|
|
Active listings vs. average week |
+15.8% |
|
Listing views per property vs. average week |
−31.1% |
|
Time on market vs. seasonal peak pace |
+12 days |
|
Median listing price vs. seasonal peak |
−5.4% |
|
Share of listings with a price cut vs. average week |
+9.0% |
|
New listings vs. average week |
+1.4% |
Source: Realtor.com 2026 Best Time to Buy Report, as reported via PR Newswire, September 10, 2026.
Read that table the way an investor should: more listings, fewer eyeballs per listing, longer time on market, and a meaningfully higher share of sellers cutting price. None of those numbers say "everything is cheap." They say "sellers have less leverage than usual, and buyers who show up prepared have room to negotiate."
What's Actually Happening on the Ground Right Now
The Best Week projection is a seasonal pattern built on historical data, but it's landing on top of a St. Louis market that's already been shifting toward buyers all year. A few numbers worth knowing as of this month:
Inventory is up sharply. Active residential listings across the greater St. Louis metro climbed roughly 15.2% year-over-year to more than 5,850 available homes heading into early September, according to regional MLS data compiled by St. Louis REALTORS®. Widen the lens to the full metro area and the number is even bigger — total homes listed for sale across Greater St. Louis reached 9,864 units, up 13.9% from the same point in 2025.
Sellers are getting more flexible on price. By late August, 17.9% of active listings across the region had logged at least one price cut, about 1.1 percentage points higher than a year earlier. Months of supply has crept up from roughly 2.2 to closer to 2.9, which is still on the tight side of a balanced market, but it's the biggest single move toward equilibrium the region has seen in years.
Financing costs are the real headwind. Freddie Mac's Primary Mortgage Market Survey had the 30-year fixed rate averaging 6.76% as of September 10, 2026, and by mid-month several lender surveys were showing daily quotes drifting toward, and briefly past, 7% — a one-year high. That's the mechanism doing most of the work behind rising inventory: retail buyers are more payment-constrained than they were a year ago, so homes are sitting longer and sellers are adjusting.
Prices haven't crashed — they've split. This is the part that trips people up. Even with all that added inventory, the combined City and County single-family median sold price actually rose 5.9% year-over-year to $350,000, while the broader metro median climbed to $310,000. What's happening underneath that headline is a two-track market: move-in-ready homes in strong school districts are still going under contract in about four to seven days, while older, deferred-maintenance homes are the ones sitting on the market for 44-plus days and absorbing most of the price cuts. That split matters enormously for how you should be sourcing deals — more on that below.
Figure 1. Active residential listings, St. Louis metro, reported endpoints for 2026
Source: MARIS data via St. Louis REALTORS®, as reported by "St. Louis Market 2026: 3 Must-Make Investor Adjustments", September 12, 2026.
That 42% swing in six months isn't a crash — it's supply finally catching up to demand after years of being pinned down. For investors, that's the whole ballgame: more product to choose from, and sellers who are increasingly willing to talk.
Financing the Deal in Today's Rate Environment
Seasonal timing can hand you a motivated seller, but it can't fix a deal that doesn't pencil at current borrowing costs — and right now those costs are the single biggest variable in the room. Freddie Mac's benchmark has been climbing for four straight readings, and daily lender surveys put the 30-year fixed at a one-year high this week. That matters differently depending on how you're structuring a purchase:
- Conforming, owner-occupant financing is running close to 6.76–7.08% depending on the lender and the day, which is the rate most of your retail exit buyers will be shopping with if you're planning a flip.
- DSCR rental financing is typically sitting a point or two above conforming — figure roughly 7.5–8.5% for most investor-focused lenders working in eastern Missouri right now.
- Hard money and private bridge financing for acquisition and rehab is still commonly quoted in the 11–13% range, which only makes sense if your hold period is short and your exit is realistic.
The practical takeaway is to lock your underwriting assumptions to whatever rate environment you can actually close in — not the rate from three months ago, and not an optimistic guess about where the Fed goes next. If a deal only works at a rate that's already 50 basis points below where the market sits today, it's not really a deal yet.
Where the Deals Are Concentrated
The two-track pattern described above isn't evenly spread across the metro — it shows up more sharply in some submarkets than others. Inner-ring suburbs and older housing stock in North County and parts of South City tend to carry more of the deferred-maintenance inventory that's driving the region's rising days-on-market numbers, while top-tier school districts in St. Louis County keep absorbing move-in-ready product almost as fast as it lists. That's not a judgment about any particular neighborhood — it's simply where the negotiating room tends to concentrate right now.
For an investor building a watchlist, that means spending disproportionate time in the submarkets where 45-plus-day listings and multiple price cuts are common, rather than spreading attention evenly across the whole metro. A property that's been sitting since July in a softer pocket of the market is a fundamentally different conversation with a seller than a fresh listing in a district where everything still moves in a week.
Four Things the "Best Week" Doesn't Mean
It's worth being blunt about this, because the seasonal-timing headlines tend to get oversimplified the further they travel from the original report.
It doesn't mean every property will be discounted
Well-maintained homes in strong submarkets — Clayton, Ladue, Kirkwood, Webster Groves, and similar pockets — are still commanding solid prices and moving quickly. The Best Week statistics are metro-wide averages; they don't erase the two-track market described above.
It doesn't mean prices are guaranteed to fall
That −5.4% figure in Table 1 is measured against the seasonal peak, typically May or June — not against last year. St. Louis median sold prices are still up nearly 6% year-over-year. A property that's 5% off its own spring peak can still be more expensive than it was twelve months ago.
It doesn't mean you should wait until the week arrives to start working
The best deals in this market are coming from off-market sourcing, expired listings and motivated sellers who've been marinating on the MLS for weeks — not from investors elbowing each other for the same fresh listing during the "best week" itself.
It doesn't mean every property becomes a good investment
Seasonal timing can hand you better negotiating leverage, but the underwriting still has to work at today's financing costs — 30-year conforming rates near 6.76–7%, DSCR loans in the 7.5–8.5% range, and hard money running 11–13%. A soft market doesn't rescue bad math.
The Six-Week St. Louis Acquisition Playbook
The way to use this window isn't to wait for it — it's to treat the six weeks between now and October 31 as a structured preparation-and-execution cycle. Here's how that breaks down for St. Louis investors specifically.
Phase 1 · September 18–30
Build Your Watchlist
This is the research phase. Identify and start tracking:
- Listings sitting 30+ days on market in your target submarket
- Properties with two or more price cuts totaling 8–10%+ off the original list
- Vacant homes, which carry higher monthly holding-cost pressure for the seller
- Fixer-uppers that retail buyers can't finance easily at today's rates
- Failed and back-on-market listings — expired, cancelled or withdrawn, then re-listed
- Small landlords with 60+ DOM multi-family listings who may be tired of rising maintenance and insurance costs
Put it all in a spreadsheet: address, original price, current price, days on market, number of reductions, estimated repair cost, ARV, and your maximum acquisition price.
Phase 2 · October 1–15
Follow Up and Update
Re-contact every lead from Phase 1. For each one, update the price, the current days on market, and anything you can learn about the seller's situation — a relocation, an estate settlement, financial pressure. Check the property condition again for visible deterioration, and ask listing agents whether a previous contract fell through and why. Recalculate your maximum allowable offer using fresh comps, and submit updated offers on your strongest leads.
Phase 3 · October 16–24
Re-Run Your Numbers
Right before the Best Week arrives, pull fresh closed sales from the last 60–90 days and re-check your ARV against current buyer affordability at 7%-ish rates. Get updated contractor estimates with a 15–20% contingency built in, confirm current financing terms with your lenders, and update your holding-cost math on taxes, insurance and utilities. Check how much competing inventory is sitting in your submarket — more competition among sellers generally means more leverage for you.
Phase 4 · October 25–31
Execute
This is the window itself. Re-approach your Phase 1–3 targets, revisit any offers that were rejected in September (motivation tends to build the longer a property sits), and ask listing agents about deals that fell out of contract. Submit written offers within your maximum acquisition range, and lean on timing, certainty of close and as-is terms as negotiating tools beyond just price. Follow up quickly but professionally, and set 30-day reminders on anything that doesn't land right away.
Adjusting Strategy by Experience Level
Not every investor should be working this window the same way.
If you're just getting started
Pick one or two St. Louis submarkets and learn them cold rather than trying to cover the whole metro. South County (63123/63125), North County (63136/63135) and South City (63116/63118) are all reasonable places to start. Drive the neighborhoods weekly, note which houses are sitting and which are dropping in price, and build a real feel for repair costs, rental rates and ARV ranges in that specific footprint. Depth beats breadth when you're new.
If you've got a track record
Segment your CRM by motivation level and run a seasonal outreach campaign against it. A rough tiering system:
- Tier 1 — two or more price cuts, 45+ DOM, vacant or an estate sale: push aggressive outreach heading into the October 25–31 window.
- Tier 2 — one price cut, 30–45 DOM, occupied: moderate outreach with a steady follow-up sequence.
- Tier 3 — fresh price cuts, under 30 DOM: monitor for now and hold for a Q1 2027 push.
Track your conversion rate by tier over the six weeks, and let that data — not gut feel — decide where you concentrate outreach next season.
A Worked Example
Illustrative example only — not actual St. Louis listing data
Say you spot a 3-bedroom, 2-bath ranch in Florissant (63136) in mid-September, listed at $169,900 after two price cuts from an original $189,900. It's sat 52 days, sits vacant, and needs roughly $35,000 in repairs.
Sept 18–30: Add it to the watchlist. Drive by, confirm the vacancy and dated interior, and run comps — ARV lands around $235,000, putting your maximum acquisition price near $155,000.
Oct 1–15: Now at 67 DOM with no new reduction. The listing agent confirms the seller is relocating and wants to close by November 30. You offer $152,000 cash, as-is, 21-day close — rejected, with a counter at $162,000.
Oct 16–24: Comps still support a $235,000 ARV and financing costs haven't moved, so you revise your max to $158,000.
Oct 25–31: The listing is now 81 days old with a fresh cut to $159,900. You resubmit at $155,000 cash, as-is, 14-day close with a 30-day rent-back for the seller — and this time, it's accepted.
The lesson isn't that the "best week" magically produced the deal. It's that consistent follow-up across the whole six-week window, paired with the seller's rising motivation, is what closed it.
Six-Week Action Checklist
- Sept 18–30: Identify 30+ target properties across your submarket(s)
- Sept 18–30: Build a tracking spreadsheet with price, DOM, reductions, repair estimate, ARV and max offer
- Sept 18–30: Drive every property on the list and log condition notes
- Sept 18–30: Start outreach on your top 10 leads
- Oct 1–15: Re-contact every Phase 1 lead and refresh price, DOM and motivation
- Oct 1–15: Submit updated offers on your top 5–7 leads
- Oct 16–24: Re-run comps, ARV and repair estimates on all active leads
- Oct 16–24: Confirm current financing terms with your lenders
- Oct 25–31: Contact every qualified lead and revisit earlier rejections
- Oct 25–31: Submit written offers and follow up within 48 hours
Questions Investors Keep Asking
Should I just wait until October 25 to start making offers?
No — and this is probably the single most common mistake. By the time the Best Week arrives, the properties worth chasing are the ones where you've already built a relationship with the seller or listing agent, already know the comps cold, and already have financing lined up. Showing up cold on October 25 puts you in competition with every other prepared investor who's been working the same leads for weeks. The window rewards preparation, not timing.
Does this apply to both flips and buy-and-hold rentals?
Mostly yes, with one caveat. Flippers need to pay closer attention to what conforming mortgage rates are doing, since that's what your eventual retail buyer will be financing with. Buy-and-hold investors care more about DSCR pricing and whether market rents in a given submarket support debt service at 7.5–8.5%. Both strategies benefit from the same underlying conditions — more inventory, longer days on market, more price cuts — but the underwriting math you're running against those conditions is different.
What if mortgage rates keep climbing through October?
Build that possibility into your Phase 3 re-run rather than treating today's rate as fixed. If conforming and DSCR pricing move meaningfully between now and late October, your maximum acquisition price needs to move with it. A deal that pencils at 6.76% doesn't automatically still pencil at 7.25%, and it's a lot cheaper to catch that in your spreadsheet than after you've submitted an offer.
How is this different from just watching for price drops?
Price drops are a lagging signal — by the time a listing shows two reductions, plenty of other investors have probably already noticed it too. The six-week approach outlined above is about tracking a property's whole trajectory — days on market, condition, seller circumstances, prior failed contracts — so you can act on rising motivation before it's obvious to everyone else watching the same MLS feed.
The Bottom Line
St. Louis' projected best buying window — October 25 through 31, 2026 — is a useful seasonal signal, not a strategy on its own. The metro is already moving toward buyers this fall, with inventory up double digits, price cuts more common, and financing costs keeping retail demand in check. Investors who treat the next six weeks as a build-and-execute cycle, rather than a countdown to a single week, are the ones who'll actually be in position when seller motivation and their own underwriting finally line up.
It's also worth remembering that this window closes as quickly as it opens. Realtor.com's own data shows the Best Week advantage is temporary by design — inventory tightens back up, price cuts get less frequent, and the negotiating room that builds through September and October doesn't just sit there waiting through the winter. Investors who show up on November 1 with the same watchlist they started in September, having done none of the follow-up work in between, will find the leverage has already started shifting back toward sellers.
That's really the whole argument for the six-week approach over a single-week mindset. The properties that close successfully during the Best Week are almost never the ones an investor discovers for the first time that week. They're the ones that have been tracked since mid-September, followed up on twice, re-underwritten as conditions changed, and pursued with an offer that reflects where the seller actually is — not where they were a month earlier. The calendar can tell you when the odds tilt further in your favor. It can't do the sourcing, the follow-up, or the underwriting for you.
None of this requires predicting where mortgage rates go next or guessing whether the broader market corrects. It just requires the unglamorous work of building a real watchlist now, checking back in on it twice before the window opens, and being ready to move when a seller's situation and your numbers finally meet in the middle. Do that consistently, submarket by submarket, and the last week of October stops being a deadline to chase and starts being the week where the groundwork you already laid finally pays off.