September 2026 St. Louis Housing Outlook: Action Plan
Sep 05, 2026
Written by House Sold Easy Team
The transition from late summer into early autumn marks a defining moment for the Greater St. Louis residential property landscape. As the region enters September 2026, the local market is moving past the rapid price swings and acute inventory constraints that characterized the 2021 through 2024 cycles. In their place is a more nuanced, bifurcated market structure. Participants across the region are encountering an environment where active listings are expanding, median sold values remain resilient, and the balance of negotiating leverage varies dramatically depending on hyper-local sub-market boundaries, price tiers, and overall property condition.
According to verified regional MLS statistics released in late August 2026 by St. Louis REALTORS® and MARIS, active single-family home inventory across the combined footprint of St. Louis City and St. Louis County climbed by 15.2% year-over-year in July 2026, reaching 3,563 available homes. Across the broader Greater St. Louis metropolitan area, total homes listed for sale reached 9,864 units—an increase of 13.9% compared to the same period in 2025, as documented by Homes.com. Yet, contrary to assumptions that an influx of available supply would trigger regional price drops, median closed values have continued their steady upward trajectory. The combined City and County single-family median sold price rose 5.9% year-over-year to $350,000, while the St. Louis metropolitan median sale price increased 3.7% year-over-year to $310,000.
This divergence demonstrates that St. Louis is operating as a distinct two-track housing market. Desirable, move-in-ready residential properties situated in high-demand municipal corridors and top-tier school districts continue to attract steady interest, often going under contract within 4 to 7 days. Concurrently, functionally obsolete properties, homes requiring major deferred capital improvements, or listings with aspirational price tags are lingering on the market for 44 days or more. These properties frequently require formal price reductions and seller concessions to secure a buyer.
Navigating this changing autumn environment requires moving beyond broad national housing narratives and focusing on local, street-level data. Whether you are actively shopping for a home, preparing to list a property, managing an investment portfolio, or tracking personal home equity, your success in September 2026 relies on making data-driven decisions tailored to the St. Louis metropolitan area.
Current St. Louis Market Context: Anatomy of a Transition
To understand why the St. Louis market is behaving differently from other major metropolitan areas across the Midwest, it is necessary to examine the interaction between mortgage rates, localized inventory patterns, and regional affordability advantages.
The national macroeconomic backdrop continues to influence local transaction activity. As reported in the Freddie Mac Primary Mortgage Market Survey published on August 28, 2026, the 30-year fixed-rate mortgage averaged 6.66% for the week ending August 27, 2026. This reflects a 29-basis-point increase compared to late August 2025. Furthermore, Fannie Mae's August Housing Forecast projects that benchmark 30-year borrowing rates will hover around 6.8% through the end of 2026 and persist near those levels throughout 2027. This reality eliminates the expectation of a sudden return to 3% to 5% financing costs, making monthly payment affordability the central consideration for prospective home purchasers.
Despite these higher borrowing costs, the St. Louis real estate market has maintained steady underlying demand. This resilience stems largely from the region's enduring affordability advantages over coastal and Sunbelt metros. When prospective residents and local families evaluate monthly debt service relative to median household earnings, St. Louis continues to provide accessible price-to-income ratios. However, local buyers are encountering strict affordability boundaries that have altered shopping behavior and neighborhood-level demand patterns across the region.
At the same time, regional inventory is experiencing its most pronounced thaw in four years. For several years, homeowners with locked-in 3% mortgage rates refrained from listing, restricting secondary market supply. By late summer 2026, essential life catalysts—such as family relocations, career advancements, downsizing, and estate transitions—have steadily outweighed the lock-in effect. This steady return of listings has expanded St. Louis metropolitan months of housing supply to 2.6 months, reflecting an 18.2% expansion from the 2.2 months recorded a year earlier, according to market analysis by House Sold Easy. In St. Louis County specifically, supply has grown from approximately 1.5 months in previous cycles to 3.16 months in late summer 2026, as tracked by MORE, REALTORS®.
This supply recovery has established a more balanced operating environment. Buyers are no longer forced into situations where every listing automatically triggers a bidding war with waived contingencies. Conversely, sellers can no longer assume that overpricing their homes will go unchecked by buyers. Understanding how these baseline metrics interact across distinct local jurisdictions is critical for anyone active in the market this fall.
Detailed Market Data and Inventory Dynamics
An examination of late August 2026 housing data reveals that while headline figures show price stability, transaction velocity is increasingly dividing the market into distinct segments. The average days on market across the Greater St. Louis footprint held steady at 23 days in July 2026 data released in August by House Sold Easy. However, this overall average masks a wide distribution.
The share of active listings undergoing at least one formal price reduction rose to 17.9% across the metro area—a year-over-year increase of 1.1 percentage points. In sub-markets with higher concentrations of aging or non-updated homes, price reduction rates are tracking even higher. Sellers who initially tested the market with prices above recent neighborhood comps have seen showing activity drop sharply after the first two weekends, making downward adjustments necessary to attract qualified buyers.
Median listing price metrics also reflect ongoing structural shifts. In St. Louis County, the median listing price settled at $250,000 in July 2026 data released in August by MORE, REALTORS®, representing a 13.76% decrease from the listing peaks recorded during the prior year. This drop in median listing prices alongside an 8.47% increase in the County’s median closed sale price ($320,000) highlights an important market trend: sellers are pricing more realistically from the start, while closed transactions remain concentrated in well-maintained, higher-quality properties.
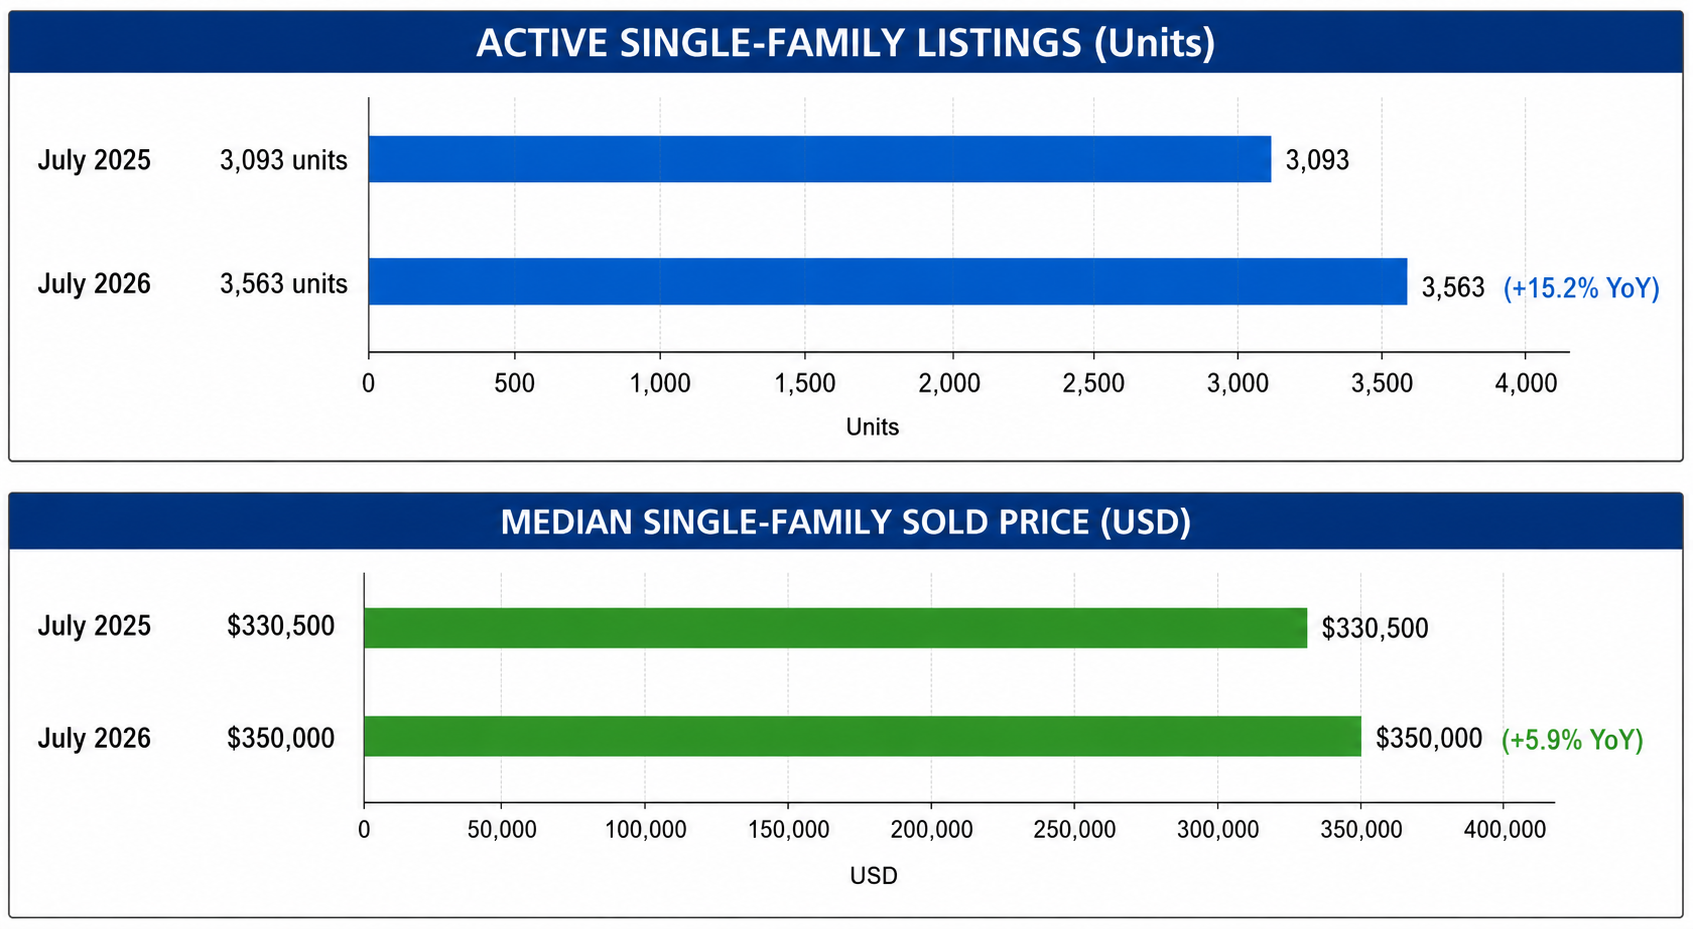
GRAPH 1 — Primary Market Trend: Single-Family Active Inventory vs. Median Sold Price
St. Louis City & County Active Single-Family Listings vs. Median Sold Price
Source: St. Louis REALTORS® / MARIS (via Dawn Griffin Group Market Reporting)
The Graph illustrates the defining structural dynamic of the St. Louis real estate market heading into September 2026: expanding active inventory paired with resilient closed price appreciation. Between July 2025 and July 2026 (based on verified MLS data published by St. Louis REALTORS® and MARIS), active single-family listings across St. Louis City and St. Louis County grew from 3,093 to 3,563 available properties. This addition of 470 active homes represents a 15.2% increase in regional inventory. Concurrently, the median single-family sold price climbed from $330,500 to $350,000, an increase of 5.9% year-over-year.
This dynamic shows that inventory growth has not saturated buyer demand. In an oversupplied market, a 15.2% increase in available listings would typically lead to price depreciation. In St. Louis, however, supply began this cycle at historically low levels. The recent influx of listings has normalized inventory from acute shortages toward balanced market liquidity without creating an oversupply. For prospective buyers, this shift provides a broader selection of properties without signaling a market downturn. For homeowners and sellers, it demonstrates that built-up home equity remains secure, provided that individual listing prices are aligned with local comps and property conditions.
Local St. Louis Geographic and Sub-Market Divergence
A central reality of the St. Louis housing market in September 2026 is that the region does not perform uniformly across municipal lines. Market metrics, price appreciation rates, and buyer competition vary significantly among St. Louis County, St. Louis City, and St. Charles County.
St. Louis County Sub-Markets
St. Louis County continues to lead the region in overall value growth. With a median sold price of $320,000 in July 2026—an 8.47% year-over-year increase documented by MORE, REALTORS®—the County has absorbed new listings while maintaining competitive conditions across several key sub-markets:
-
Central County (Clayton, Ladue, Frontenac): The regional luxury market remains partially insulated from interest rate fluctuations due to a higher proportion of cash transactions. Updated, move-in-ready single-family listings in Clayton and Ladue continue to command premium price-per-square-foot values, supported by low months of inventory supply.
-
Mid-County and Inner Suburbs (Kirkwood, Webster Groves, Brentwood): Driven by walkable historic business districts, municipal amenities, and top-rated public school districts, these communities remain highly competitive. Single-family homes priced under $550,000 frequently receive multiple offers within their first week on the market, provided they feature modern updates.
-
South County (Mehlville, Oakville, Affton): South County continues to see strong demand from middle-market buyers. Offering sturdy construction, accessible property taxes, and established residential neighborhoods, well-maintained brick ranch and traditional two-story properties in Affton and Oakville priced between $250,000 and $375,000 continue to sell quickly.
-
North County (Florissant, Hazelwood): North County communities provide some of the most accessible entry-level homeownership opportunities in the metropolitan area. However, active inventory has accumulated faster in these areas, with marketing times lengthening to 35 to 45 days. Buyers in Florissant and Hazelwood hold greater negotiating room regarding inspection repair allowances and closing cost credits.
St. Louis City Neighborhood Dynamics
In contrast to the strong price appreciation in St. Louis County, St. Louis City presents a flatter price trend. The City's median sold price settled between $261,000 and $265,000 in late summer 2026, representing modest year-over-year movement (+0.77% to +6.9% depending on reporting methodology and property mix, as noted in market data from Homes.com and Hermann London Real Estate).
-
Historic South Side Corridors (Tower Grove South, Shaw, Soulard, Benton Park): Buyer demand remains consistent for renovated historic brick single-family homes and multi-family properties. Proximity to Tower Grove Park, local dining corridors, and active neighborhood associations keeps days on market relatively short (10 to 18 days) for fully updated properties.
-
Central West End (CWE): The Central West End continues to benefit from its proximity to BJC HealthCare and the Washington University Medical Campus. High-end single-family residences and luxury historic condominiums command solid valuations, though standard condominium units face longer marketing periods due to higher monthly HOA fees and stricter lending guidelines.
-
Downtown and Downtown West: Condominium inventory remains elevated, leading to longer average days on market and softer pricing trends. Buyers exploring loft properties in the urban core have greater negotiating power, with opportunities to secure price concessions and seller-paid parking or assessment credits.
St. Charles County
To the west, St. Charles County (including O'Fallon, St. Peters, Wentzville, and Cottleville) maintains steady transaction activity. Buyers looking for newer construction, open floor plans, and suburban school districts continue to direct capital into this sub-market. While ongoing residential construction deliveries have added active inventory to the Wentzville and Lake St. Louis corridors, consistent buyer demand has kept median sales prices stable in the $340,000 to $365,000 range.
Secondary Market Comparison: St. Louis City vs. St. Louis County Performance Metrics
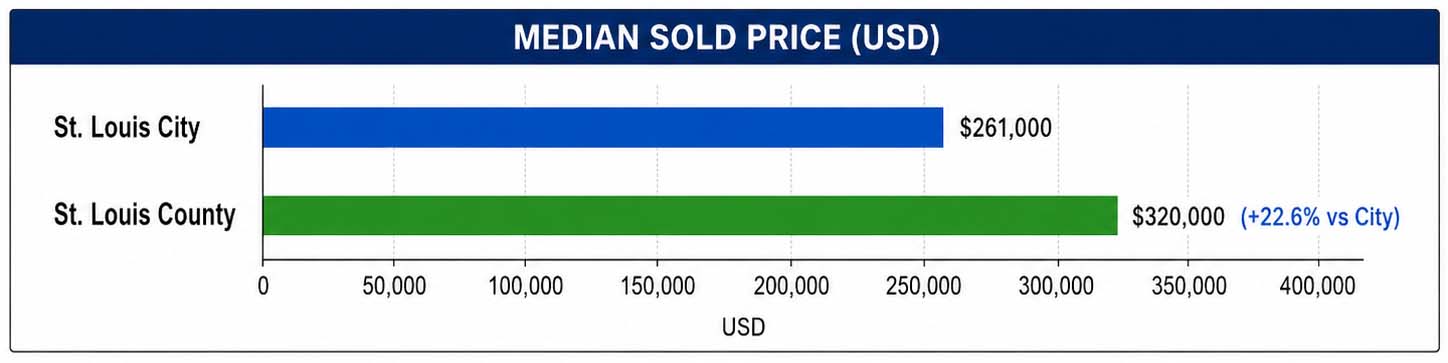
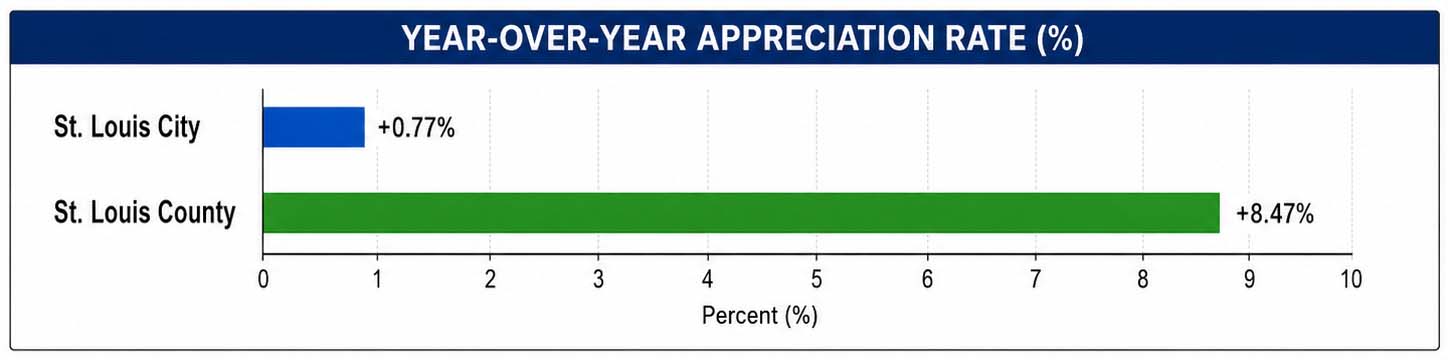
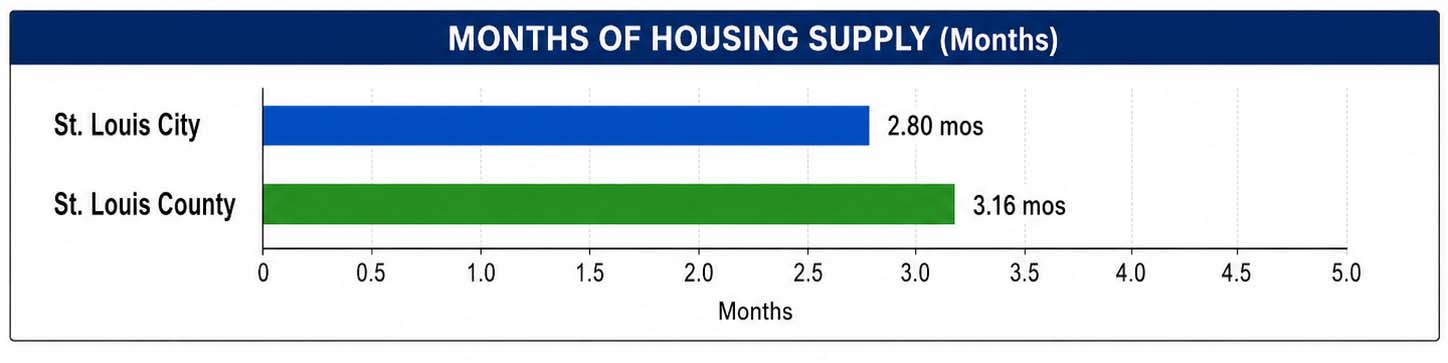
Graph 2 outlines the performance gap between St. Louis City and St. Louis County as of late summer 2026. St. Louis County commands a higher median sold price of $320,000 compared to the City’s $261,000—a difference of 22.6%. The annual appreciation rates highlight this divergence further: County single-family values grew by 8.47% year-over-year, while City median values experienced a modest 0.77% increase, based on reports from MORE, REALTORS® and Homes.com.
Months of housing supply provides additional context for these numbers. St. Louis County inventory has expanded to 3.16 months, while the City sits near 2.80 months. The County's faster price growth alongside higher available supply indicates steady buyer depth: suburban demand continues to absorb incoming inventory at higher price points, driven by families prioritizing yard space and specific school districts. In contrast, the City's flatter pricing despite slightly lower overall supply reflects a more price-sensitive buyer pool navigating municipal property taxes, insurance underwriting adjustments, and differing demand across individual city neighborhoods.
Action Plan: What This Means for Buyers
For prospective homebuyers entering the St. Louis market in September 2026, the current environment offers more choices and negotiating flexibility than any fall season in recent years. However, succeeding in this market requires careful preparation and a disciplined approach to financing and property evaluation.
Navigating the Current Mortgage Rate Environment
With 30-year fixed mortgage rates averaging 6.66% as of late August 2026 and Fannie Mae forecasting rates to remain near 6.8% through year-end, buyers should avoid delaying purchases in the hopes of a quick return to 4% or 5% rates. In practical terms, a 0.5% rate change alters monthly principal and interest payments on a $300,000 mortgage by approximately $100 per month. Rather than waiting on broad economic shifts, buyers should focus on practical financing strategies to optimize their payments:
-
Seller-Paid Temporary Rate Buydowns: For homes that have been on the market for more than 21 days, ask the seller to fund a 2-1 or 1-0 temporary rate buydown. A 2-1 buydown lowers the borrower's effective note rate by 2.0% in the first year and 1.0% in the second year, providing meaningful monthly savings during the initial transition into the home.
-
Upfront Underwritten Pre-Approvals: Secure a fully underwritten mortgage approval rather than a simple pre-qualification letter. In competitive areas like Webster Groves, Kirkwood, or South City, having an underwritten approval allows buyers to submit clean offers with 14- to 21-day closing timelines, helping them compete effectively against cash buyers.
Capitalizing on Older Listings
The metro-wide average of 23 days on market is an aggregate figure. Properties that have remained active for 30 days or more often present the best opportunities for negotiation. These listings frequently suffer from minor cosmetic flaws, poor listing photography, or an initially ambitious asking price rather than serious structural problems. Buyers should evaluate these properties for cosmetic improvement opportunities that can build immediate equity.
Structuring Strategic Offers
When competing for updated, move-in-ready homes in high-demand pockets, maintain clean contingencies while preserving essential protections. Rather than waiving inspections entirely, consider using an inspection repair deductible (such as agreeing not to request repairs for individual items costing under $1,000). This provides the seller with transaction certainty while protecting the buyer against major structural, mechanical, roof, or sewer lateral issues.
Action Plan: What This Means for Sellers
For St. Louis home sellers, the September market requires moving away from the speculative pricing strategies of previous years. With active inventory expanding by 15.2% and 17.9% of metro listings undergoing price reductions, buyers are taking a more selective approach.
Pricing Accurately from Day One
The single most important factor in securing a timely sale is setting an accurate listing price based on hyper-local closed sales from the preceding 60 to 90 days. In St. Louis County, where median list prices have adjusted downward by 13.76% as sellers align with prevailing market realities, overpricing a home by even 4% to 6% often leads to stalled showing activity.
Properties typically see their highest showing volume and online views during the first 14 days on market. If an overpriced home sits for more than 21 days without offers, the listing loses initial momentum, often resulting in price cuts that lead to a lower final sale price than a realistic initial price would have produced.
Enhancing Property Condition and Presentation
With 3,563 active single-family listings across the City and County, buyers are actively avoiding deferred maintenance. To maximize net proceeds and minimize time on market, sellers should focus on high-impact preparations prior to listing:
-
Complete a pre-listing municipal occupancy inspection and resolve any code issues upfront.
-
Perform a preventative sewer lateral camera scope, especially on older housing stock in areas like University City, Maplewood, or South City, to avoid unexpected repair negotiations during closing.
-
Apply fresh neutral paint to high-traffic areas, service heating and cooling equipment, and enhance front yard curb appeal to create a positive initial impression.
Setting Clear Adjustment Timelines
Every seller should establish a clear adjustment timeline before launching their listing. If a property receives fewer than 4 showings and zero offers within its first 14 to 21 days, implement a planned price reduction of 3% to 5% to reset the listing across buyer search notifications, rather than making small, incremental cuts that signal distress.
Action Plan: What This Means for Investors
Real estate investors active in the Greater St. Louis market must balance current financing costs against local tenant demand trends. Narrower cap rates and tighter lending guidelines make disciplined, cash-flow-focused underwriting essential.
Underwriting with Conservative Assumptions
All investment pro-formas in September 2026 should be modeled using borrowing rates between 7.0% and 7.5% for conventional non-owner-occupied loans, without relying on assumptions of near-term refinancing. Cash flow projections should stand on current operational performance:
-
Single-Family Rentals (SFR): Focus on stable workforce housing corridors in North and South St. Louis County municipalities (such as Florissant, Hazelwood, and Affton). These markets offer accessible acquisition costs between $130,000 and $220,000, with rental demand supporting 8% to 10% cash-on-cash yields on stabilized assets.
-
Small Multi-Family Properties (2–4 Units): Historic South City neighborhoods (including Tower Grove South, Dutchtown, Gravois Park, and Benton Park West) provide ongoing 2-to-4 unit investment opportunities. Investors should look for properties with separately metered utilities and strong occupancy histories to manage operational overhead.
Targeting Motivated Listings
With 17.9% of metro listings undergoing price cuts and days on market increasing for properties that need work, investors can find opportunities among tired landlords, estate sales, and properties with deferred maintenance. Sourcing off-market or post-30-day MLS listings allows investors to negotiate discounts that account for necessary repair and renovation budgets.
St. Louis Regional Real Estate Snapshot
The following table synthesizes key housing metrics across primary St. Louis jurisdictions, providing a comparative snapshot for market participants entering September 2026.
| Market Metric / Geography | St. Louis City | St. Louis County | Greater STL Metro | National Baseline |
|---|---|---|---|---|
|
Median Sold Price (Single-Fam) |
$261,000 |
$320,000 |
$310,000 |
$422,600 |
|
Year-over-Year Price Change |
+0.77% |
+8.47% |
+3.70% |
+2.60% |
|
Active Single-Family Listings |
812 units |
2,751 units |
9,864 units (Total) |
1,380,000 units |
|
YoY Change in Active Listings |
+12.4% |
+16.1% |
+13.9% |
+14.8% |
|
Months of Housing Supply |
2.80 months |
3.16 months |
2.60 months |
4.00 months |
|
Average Days on Market (DOM) |
28 days |
21 days |
23 days |
34 days |
|
Listings With Price Reductions |
19.2% |
17.4% |
17.9% |
18.8% |
|
Benchmark 30-Yr Mortgage Rate |
N/A |
N/A |
6.66% (Regional) |
6.66% (PMMS) |
Interpretation and Strategic Key Takeaways From Table
Table 1 highlights several key differences across local sub-markets:
-
Suburban Market Strength: St. Louis County continues to drive regional price growth, with median sale prices climbing 8.47% year-over-year to $320,000. This outperformed both the broader metro (+3.70%) and national averages (+2.60%), confirming that demand for suburban housing stock remains healthy.
-
Inventory Growth Across All Sectors: Active listings expanded across every jurisdiction—up 12.4% in the City, 16.1% in the County, and 13.9% across the entire metro. However, with regional months of supply sitting between 2.60 and 3.16 months, St. Louis remains tighter than the national baseline of 4.00 months. This ongoing supply constraint explains why local home values have held steady even as inventory has expanded.
-
The Importance of Realistic Pricing: With price reduction frequencies ranging from 17.4% to 19.2% across the area, nearly one in five sellers is having to reduce their price. Sellers who price accurately up front benefit from a fast 21-to-28 day average marketing timeline, while those who overreach quickly face extended market times.
Action Plan: What Homeowners Should Watch
For St. Louis homeowners who are not planning an immediate move, the September 2026 market offers a stable backdrop for building home equity and planning long-term property improvements.
Monitoring Accumulated Equity
With single-family median prices rising 5.9% across the City and County over the past twelve months, most local homeowners have continued to build home equity. Homeowners should track recent neighborhood sales rather than relying solely on automated online estimates. Understanding your actual equity position helps when evaluating financial options, such as removing Private Mortgage Insurance (PMI) or opening a Home Equity Line of Credit (HELOC) for home improvements.
Managing Property Taxes and Insurance Expenses
As assessed property values have updated across St. Louis County and City assessment cycles, homeowners should review their annual escrow statements. Ensuring that applicable tax relief programs (such as the Missouri Senior Property Tax Freeze for qualifying older homeowners) or standard residential exemptions are correctly applied can help avoid unexpected monthly escrow shortfalls.
Planning Practical Home Improvements
With current mortgage rates making trading up more expensive, many local households are opting to renovate their existing homes. Homeowners planning upgrades should focus on improvements that offer high daily utility and solid resale value, such as kitchen and bathroom refreshes, energy-efficient heating and cooling systems, and exterior repairs that preserve the property's structural integrity.
What to Watch During September 2026
As the market transitions into the autumn buying season, real estate participants should track four key indicators to gauge market momentum heading into the fourth quarter:
-
Post-Labor Day Listing Volume: September historically brings a secondary influx of fall listings. Monitoring whether active inventory climbs past the current 3,563 single-family benchmark will reveal whether buyer selection will continue expanding through late autumn.
-
Price Reduction Trends: If the share of listings with price cuts rises from the current 17.9% toward 20% or higher, buyers will gain additional leverage in price and concession negotiations.
-
Average Days on Market Patterns: A significant rise in average days on market beyond the current 23-day baseline would signal broader demand cooling, whereas a decline would confirm strong fall market absorption.
-
Mortgage Rate Movements: While major rate cuts are unlikely based on current forecasts, fluctuations within the 6.50% to 6.80% range will continue to directly affect monthly purchasing power for active buyers.
Market Outlook: Preparation Over Prediction
The St. Louis real estate market in September 2026 rewards objective preparation over market timing. The era of unchecked seller dominance has transitioned into a balanced, performance-driven environment where outcomes depend on local property condition, realistic pricing, and solid financial planning.
For buyers, expanding inventory offers more time to evaluate properties, complete thorough inspections, and negotiate favorable contract terms. For sellers, home equity remains strong, but achieving top value requires realistic pricing and move-in-ready presentation from day one. For investors, sustainable cash flow can be found through conservative underwriting and selective acquisitions in solid workforce neighborhoods.
By tracking local neighborhood trends and aligning your strategy with verified market data, you can navigate the St. Louis fall housing market with clarity and confidence.
Ready to Buy or Sell in St. Louis? House Sold Easy Has You Covered!
Whether you're thinking about listing your home or exploring a cash offer, it's worth understanding all of your options before making a decision. The right choice depends on your timeline, your property's condition, and your goals. Contact House Sold Easy to discuss your situation and see what makes the most sense for you.Our St. Louis experts know every corner of this city and will make buying your dream home or selling your high-end property a breeze. Don’t miss out on the hottest market in the U.S.! Contact House Sold Easy today and let’s make your real estate goals happen!