St. Louis Real Estate: Real Buyer & Seller Problems
Aug 29, 2026
Written by House Sold Easy Team
“I’m Tired of Losing Bids” and “My Home Won’t Sell”
Two Very Common St. Louis Stories
By late August, real estate conversations across the St. Louis metropolitan area have begun to sound strikingly divided.
On one side, prospective buyers express deep fatigue: “I keep losing bids. Every time I tour a home I actually like in Kirkwood, Webster Groves, or South City, there are multiple offers before the open house even wraps up. I’m starting to think I should pull out of the market and wait until next year.”
On the other side, homeowners who listed their properties earlier this summer are scratching their heads: “Our house has been on the market for four weeks. We’ve had a steady stream of weekend showings, but not a single offer. The news keeps reporting that home values are up and that inventory is still historically tight, so why is our home just sitting here?”
Both viewpoints are authentic reactions to the same market. The St. Louis real estate ecosystem in August 2026 is neither in a freefall nor caught in the chaotic frenzy of 2021–2022. Instead, it has transitioned into a bifurcated, hyper-selective market.
According to regional data published by
Meanwhile, financing conditions have settled into a distinct holding pattern. The
When 6.6% borrowing costs intersect with rising overall supply and sustained price appreciation, buyer behavior changes radically. Buyers become hyper-focused on turnkey homes that justify their monthly outlay, leaving dated or improperly priced homes on the sidelines.
Understanding the micro-level dynamics driving this divide allows both sides of the transaction to break their respective gridlocks.
What’s Changing in the St. Louis Housing Market
For the past several years, the central challenge in St. Louis real estate was an acute shortage of physical homes for sale. Buyers had to scramble for almost any functional property that hit the Multiple Listing Service (MLS), while sellers could set ambitious asking prices, offer minimal concessions, and expect multiple offers within 48 hours.
In August 2026, the underlying market mechanics look fundamentally different:
-
Inventory Is Expanding Without Crashing Prices: The overall supply of single-family homes across the City and County sits at 2.6 months of inventory.
MORE, REALTORS® August 2026 market reporting -
The Emergence of a "Two-Track" Velocity: Average single-family days on market held steady at 23 days across the broader metro, but this average obscures the extreme spread underneath.
-
Price Reductions Are Becoming Routine: Price adjustments are no longer a sign of distress; they are an essential recalibration mechanism. Approximately 17.9% to 20% of active listings across the St. Louis metropolitan area have executed at least one price reduction before securing a contract.
-
Condominium and Townhouse Dynamics Have Decoupled: While single-family detached homes remain competitive, the attached housing sector is experiencing a more pronounced cooling. Active condo and townhouse inventory surged 9.2% year-over-year, pushing available supply to 3.8 months with properties averaging 51 days on market.
Analysis of the Most Important August 2026 Data
To diagnose why buyers are losing bids and why certain homes fail to sell, we need to examine the key market indicators from regional MLS reports and mortgage indices.
| St. Louis Single-Family Housing Indicator | Late Summer 2026 | Change / Notes |
|---|---|---|
|
Active Inventory (Single-Family) |
3,563 units |
+15.2% YoY |
|
Median Closed Sales Price |
$350,000 |
+5.9% YoY |
|
Months of Unsold Inventory |
2.6 months |
Up from ~2.2 months |
|
Average Days on Market (DOM) |
23 days |
Flat YoY |
|
Condo / Attached Months of Supply |
3.8 months |
51-day average DOM |
|
30-Year Fixed Mortgage Benchmark |
6.65% |
Freddie Mac PMMS, Aug. 20, 2026 |
Source: St. Louis REALTORS® / MARIS Regional Reporting; Freddie Mac PMMS.
1. Active Listings vs. Absorption Rate
The single-family inventory pool grew to 3,563 active units, a 15.2% increase from the same time last year.
This small dip in pending transactions shows that buyer demand has not evaporated—it has simply become more concentrated. Buyers are filtering aggressively. When a top-tier listing appears, buyers converge on that single listing rather than spreading their offers evenly across the 3,563 available homes.
2. Median Sales Price vs. Median List Price Divergence
In St. Louis County, July closed-sale data released in August showed a median sold price of $320,000, an 8.47% increase compared to $295,000 in July 2025. However, the median list price for active properties in the county registered at $250,000, a notable decline of 13.76% from $289,900 a year earlier.
This divergence between asking and closing figures reveals a crucial shift in seller behavior. The active pool of inventory includes a higher concentration of entry-level homes, smaller footprint houses, and properties requiring updating that enter the market at lower price points. Meanwhile, premium homes that are updated and turnkey command strong sale prices that push the median closing metric higher.
3. Mortgage Rate Realities and Purchasing Power Compression
According to
-
On a median-priced home of $350,000 with a 10% down payment ($35,000) and a loan amount of $315,000:
-
At 6.65%, principal and interest total approximately $2,022 per month.
-
Add St. Louis County property taxes (~$400/month) and homeowners insurance (~$160/month), and the total monthly housing cost is roughly $2,582.
-
-
If mortgage rates were 5.0%, that same principal and interest payment would be $1,691—saving the buyer over $330 every month.
Because monthly carrying costs are elevated, buyers have very little financial buffer left over for post-closing renovations. They are unwilling to pay top-dollar for a home that will require $30,000 to $50,000 in immediate updates.
Visual 1 — Market Trend Graph: St. Louis Single-Family Inventory & Price Trajectory
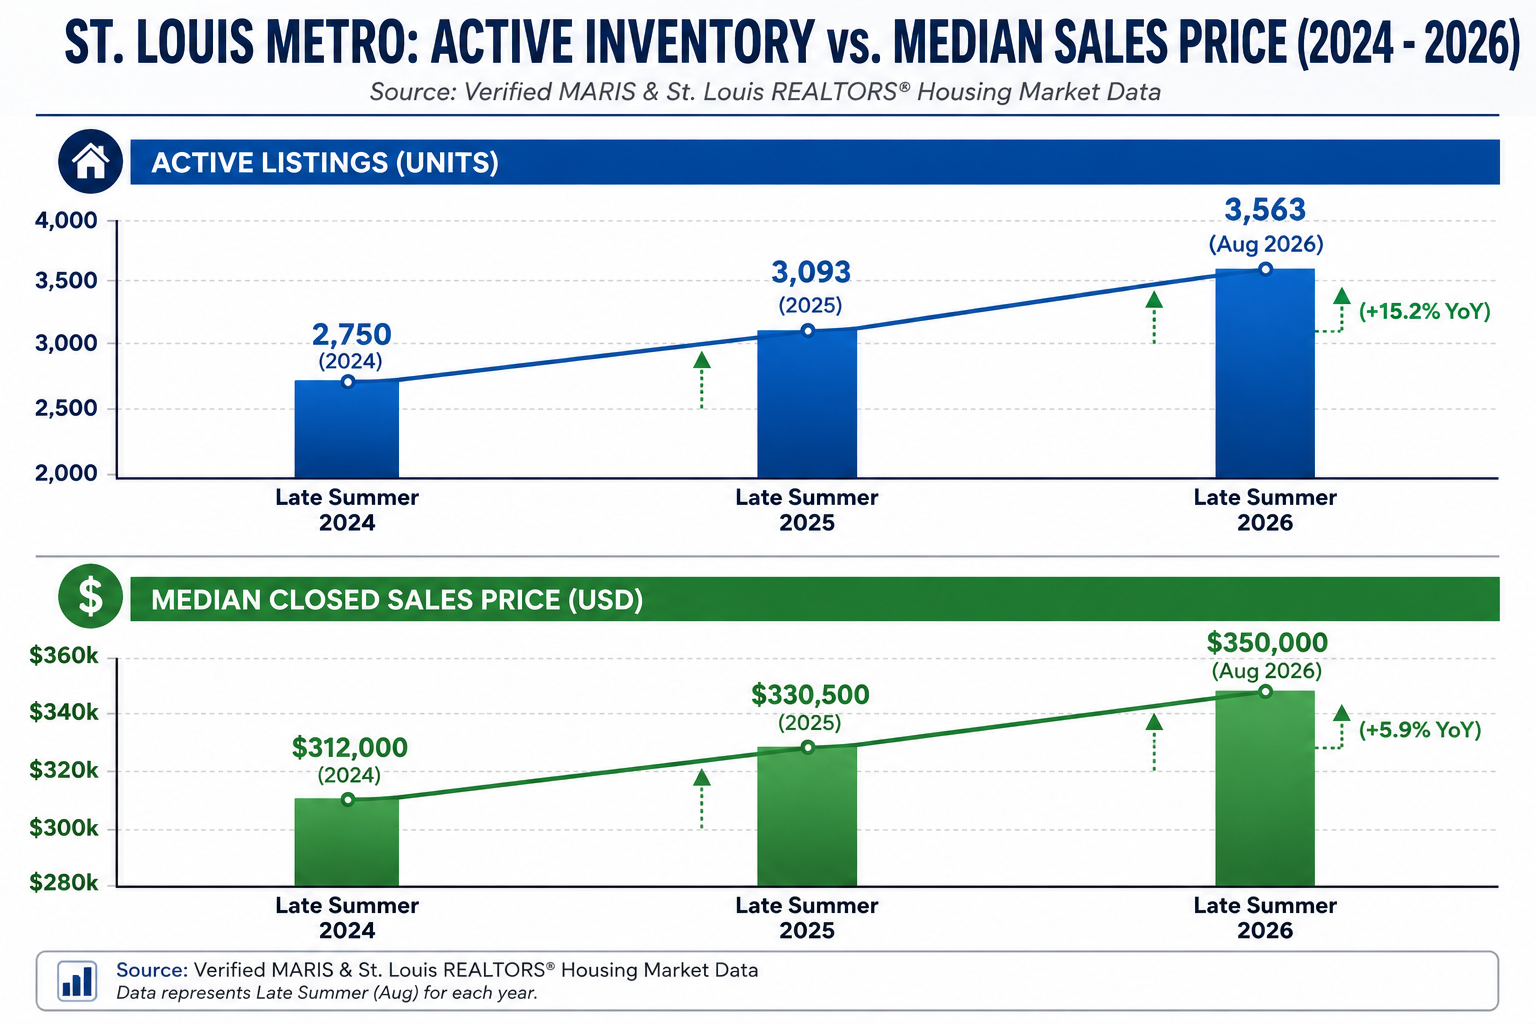
The ASCII chart below illustrates the relationship between active inventory expansion and median sales price growth across the St. Louis metropolitan area (City and County combined) from late summer 2024 through August 2026.
What This Graph Demonstrates
-
Supply Is Rebuilding Naturally: Active single-family listings have risen steadily from 2,750 units in 2024 to 3,563 in August 2026. This gives buyers more options and prevents runaway bidding frenzies across every property.
-
Price Resilience Persists: Despite supply expanding by double digits, the median price climbed from $312,000 in 2024 to $350,000 in 2026. The market is not experiencing price erosion;
Why Buyers Keep Losing Bids: The Micro-Market Reality
When buyers say, "I keep losing bids," they are rarely participating in the broader, statistical average of the market. They are competing in specific price bands, architectural styles, and school districts where inventory remains exceptionally tight.
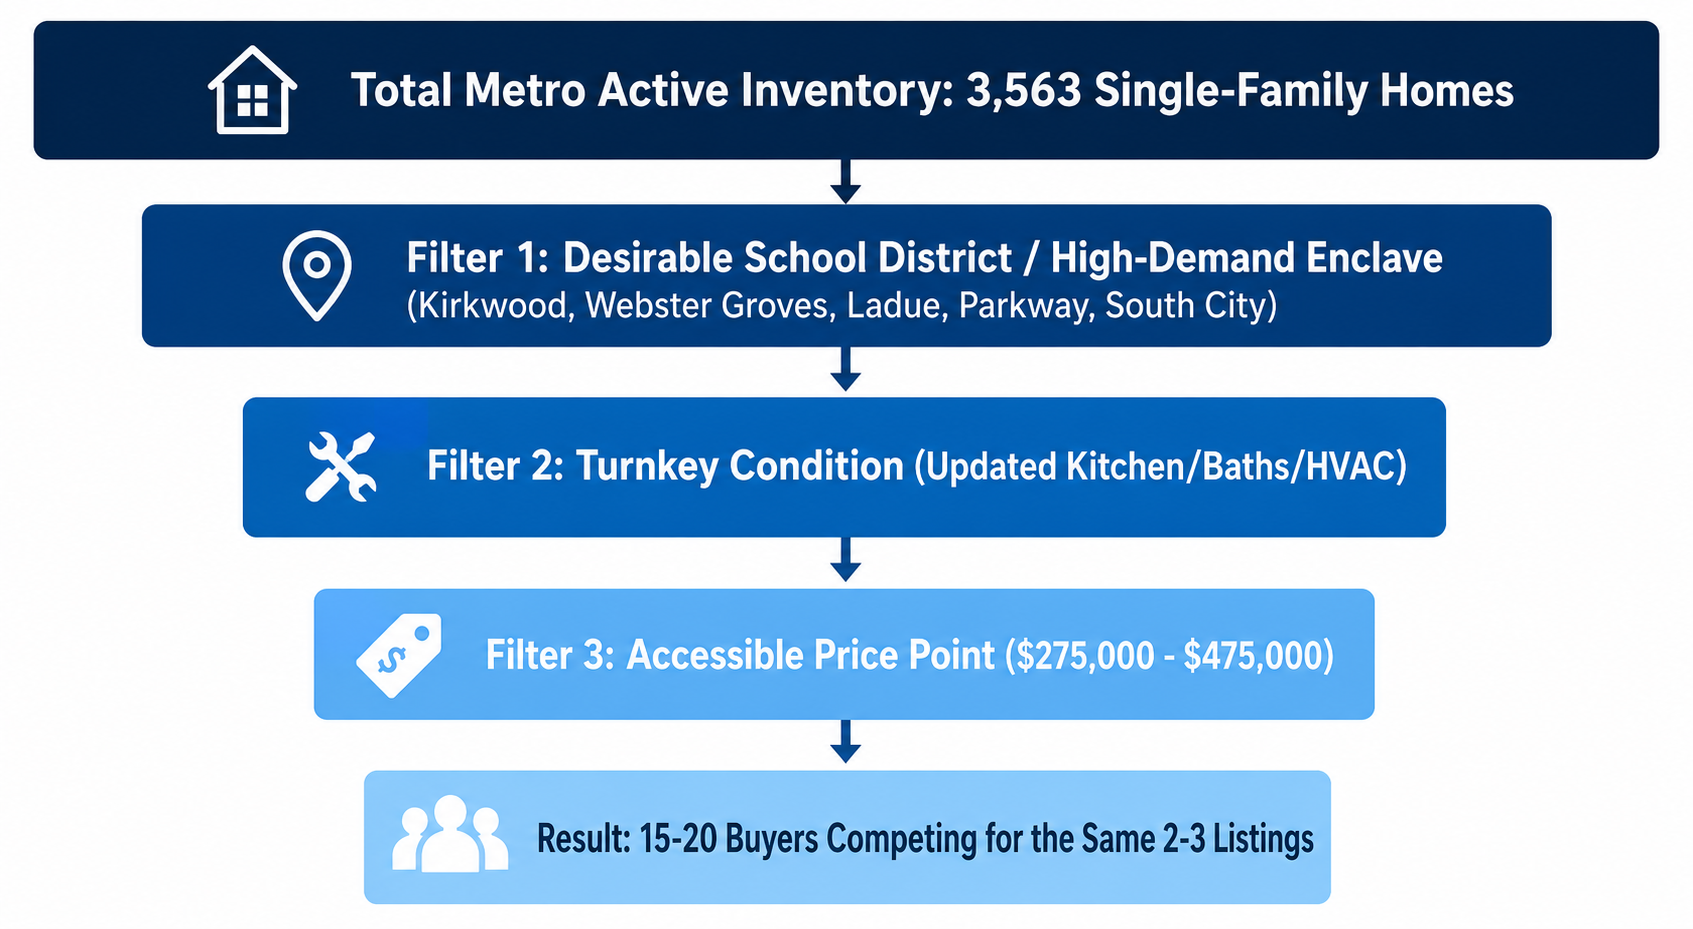
HOW BUYERS GET FUNNELED INTO BIDDING WARS
1. The "Turnkey Premium" and Renovation Aversion
With inflation in construction materials and labor costs remaining significant, alongside mortgage rates near 6.65%, the average buyer does not have $40,000 in liquid cash to renovate a kitchen, refinish hardwoods, and replace an aging roof immediately after putting down 10% to 20%.
Consequently, buyers will aggressively bid over the asking price for a home that is 100% finished, because the cost of that renovation is rolled into the 30-year fixed mortgage at a manageable incremental monthly cost. A home listed at $375,000 that needs nothing can easily receive 6 offers and sell for $400,000, while an identical layout down the street listed at $340,000 that needs $40,000 in updates sits for 45 days.
2. High Demand in Specific School Districts and Urban Corridors
Aggregate metro numbers combine areas with very different supply realities. While total listings are up 15.2%, supply in core municipalities remains severely constrained:
-
In Kirkwood (63122) and Webster Groves (63119), inventory for move-in ready 3-bedroom, 2-bathroom single-family homes under $450,000 often hovers below 1.5 months of supply.
-
In high-demand St. Louis City neighborhoods like Tower Grove South, Southampton, and the Central West End, architecturally distinct homes with modern updates regularly attract multiple offers on their first weekend.
3. The 5-to-1 Funnel Effect
Because buyers search on the same major portals using similar filters (e.g., 3+ beds, 2+ baths, garage, updated interior, under $400,000), hundreds of active buyers are routed to the exact same 5% to 10% of new listings each Thursday and Friday. This creates localized bidding wars even in a market where overall inventory is growing.
Why Sellers Feel Stuck: The "First-Week Effect" and Search Brackets
If buyer competition is fierce for top-tier listings, why are other sellers having trouble getting traction? The reasons almost always come down to pricing strategy, condition, and online positioning.
1. The Fallacy of "Testing the Market"
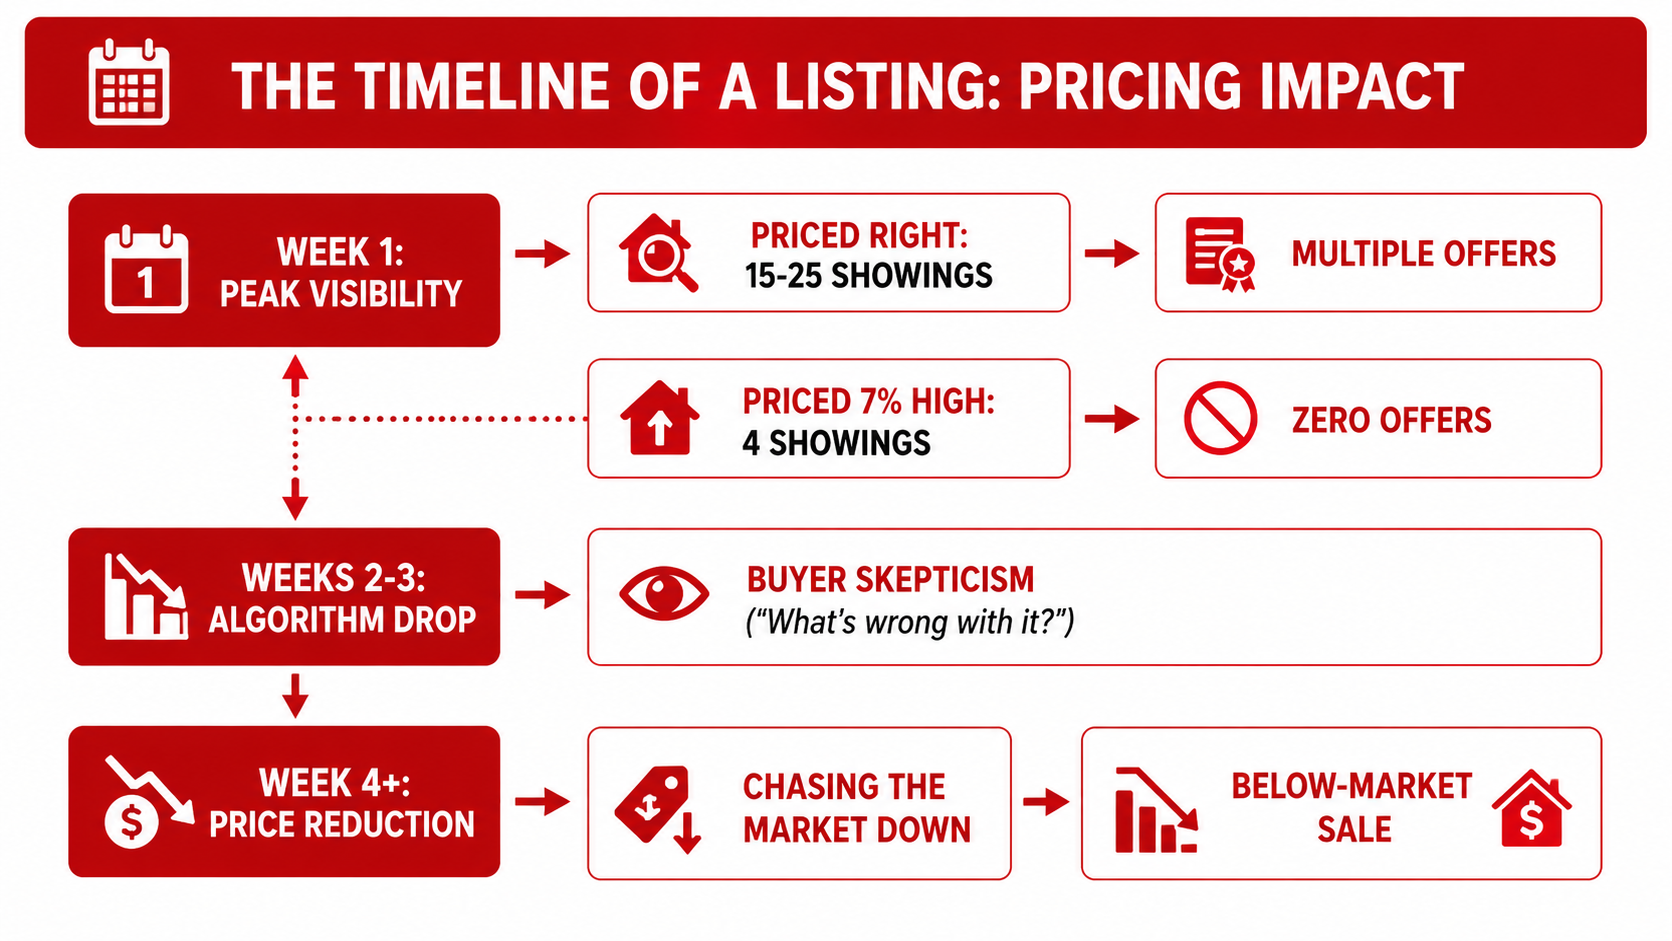
Many sellers look at recent peak sales from the spring or early summer and decide to price their home 5% higher to "leave room for negotiation."
In 2026, buyers have access to extensive market data and have toured dozens of homes online and in person. When a home hits the market overpriced, buyers do not submit low offers—they simply ignore the listing and wait for a price drop.
2. Search Bracket Traps
Online search portals filter homes in standard price bands (e.g., increments of $25,000 or $50,000).
If a home's fair market value is $395,000, but the seller insists on listing at $405,000, the property is filtered out of searches capped at $400,000. Simultaneously, it appears at the bottom of the $400,000 to $500,000 search bracket, where it must compete directly against superior homes priced near $450,000.
A strategic list price of $399,900 captures the entire buyer pool up to $400,000 while maintaining maximum visibility.
3. The "Cost-to-Cure" Disconnect
Sellers often believe buyers will see past cosmetic flaws: "It just needs new carpet and some paint; the buyer can choose their own colors."
In reality, buyers calculate the "cost-to-cure" at double or triple the actual contractor price because of the time, stress, and cash required. A dated home that needs $12,000 in paint, flooring, and landscaping often triggers a $30,000 reduction in perceived value from prospective purchasers.
Local & Submarket Breakdown: City, County, and St. Charles
Real estate conditions vary across the St. Louis metropolitan footprint. Here is how key submarkets are performing in late summer 2026:
1. St. Louis County (Central, South, and West)
According to
-
Central County (Clayton, Ladue, Frontenac): The luxury segment remains resilient. Cash buyers and high-equity move-up purchasers are less sensitive to 6.65% interest rates.
-
South County (Mehlville, Oakville, Affton): Strong demand for 1960s–1980s ranch-style homes between $250,000 and $375,000. Turnkey properties in Lindbergh and Mehlville school districts are experiencing low days on market (frequently under 10–14 days).
-
North County (Florissant, Hazelwood): An active price band for entry-level buyers and investors. Active listings have expanded, providing buyers with negotiating room on inspection items and closing costs.
2. St. Louis City (Historic Urban Core & South City)
-
South City (Tower Grove East/West, Shaw, Soulard, Benton Park): Historic brick homes with modernized plumbing, electrical, and HVAC command significant attention. Unrenovated multi-family conversions or single-family properties with structural masonry needs require realistic pricing to attract buyers.
-
Downtown & Downtown West: The loft and condo market represents the largest concentration of buyer leverage. With inventory in the condo sector reaching 3.8 months of supply, buyers can negotiate price reductions and seller-paid HOA credits.
3. St. Charles County (O’Fallon, St. Peters, Wentzville)
St. Charles County continues to attract buyers seeking newer construction, attached garages, open-concept floor plans, and strong suburban school districts.
-
Inventory in Wentzville and O'Fallon has expanded faster than in St. Louis County, driven in part by new home completions.
-
Builders and resale sellers are offering interest rate buydowns (such as 2-1 temporary buydowns) to bridge affordability gaps for buyers sensitive to monthly payments.
Visual 2 — Market Data Table: Key St. Louis Housing Indicators
The table below compiles verified regional housing statistics from Mid America Regional Information Systems (MARIS), St. Louis REALTORS®, and the Freddie Mac PMMS for late summer 2026.
St. Louis Regional Housing Market Indicators
August 2026 Benchmarks
| Indicator / Metric | Previous Period (2025) | Latest 2026 Data | YoY Change |
|---|---|---|---|
|
Metro Single-Family Active Listings |
3,093 Units |
3,563 Units |
+15.2% |
|
Metro Single-Family Median Price |
$330,500 |
$350,000 |
+5.9% |
|
Metro Single-Family Months Supply |
2.2 Months |
2.6 Months |
+18.2% |
|
Metro Single-Family Days on Market |
23 Days |
23 Days |
0.0% |
|
Metro Closed Single-Family Sales |
1,413 Sales |
1,334 Sales |
−5.6% |
|
St. Louis County Median Sold Price |
$295,000 |
$320,000 |
+8.47% |
|
St. Louis County Active Listings |
3,690 Units |
4,225 Units |
+14.5% |
|
St. Louis County Months Supply |
2.77 Months |
3.16 Months |
+14.1% |
|
St. Louis City Median Sold Price |
$260,000 |
$264,254 |
+1.6% |
|
Condo / Townhome Months of Supply |
3.1 Months |
3.8 Months |
+22.6% |
|
Condo / Townhome Median Price |
$214,000 |
$227,000 |
+6.1% |
|
30-Year Fixed Mortgage Rate Avg. |
6.58% |
6.65% |
+0.07% |
St. Louis REALTORS® / MARIS Regional July 2026 Report (Published Aug. 2026)
MORE, REALTORS® St. Louis County Market Update (July 2026 Data / Aug. 2026 Release)
Redfin St. Louis City Housing Market Data
Freddie Mac Primary Mortgage Market Survey (Week of August 20, 2026)
Strategic Playbook: What Buyers Can Do Differently This Week
If you have submitted multiple offers and keep coming up short, continuing with the same approach is likely to yield the same result. Here is how to adjust your strategy for the late August market:
Buyer Action Matrix: Where to Pivot
| Pain Point | Root Cause | Strategic Adjustment |
|---|---|---|
|
Losing in bidding wars |
Targeting 100% turnkey homes in peak-demand ZIP codes. |
Look for "cosmetically dated" homes with solid mechanicals. |
|
Stretching budget to max |
Basing search on max loan pre-approval limit. |
Set search $30k below max to leave headroom for bidding and terms. |
|
Offer rejected despite competitive price |
Weak terms, slow submission, or excessive contingencies. |
Use escalation clauses, clean inspection thresholds, and a fast close. |
1. Target the "One Cosmetic Flaw" Properties
The widest pricing disparity in St. Louis today is between fully renovated homes and homes with cosmetic obsolescence (e.g., honey oak cabinetry, dated laminate countertops, brass fixtures, or older carpet).
If a home has a 5-year-old architectural shingle roof, updated 200-amp electrical panel, and functioning HVAC, do not let dated aesthetics scare you away. You will face far less competition, can often negotiate under list price, and can complete painting and cosmetic upgrades over time.
2. Search Below Your Pre-Approval Ceiling
If your lender approves you for a $425,000 purchase price, do not search for homes listed at $425,000.
-
At $425,000, you have zero room to bid over asking on a competitive listing.
-
If you instead search for homes listed between $375,000 and $395,000, you have the flexibility to offer $410,000 with strong terms while remaining well within your monthly comfort zone.
3. Strengthen Your Contract Terms
Price is only one component of a purchase agreement. Sellers often choose an offer that provides certainty and convenience over one that offers slightly more money with higher risk:
-
As-Is with Right to Inspect: Conduct a full building inspection for your own knowledge, but agree in the contract that you will not ask the seller for minor repair credits under a certain threshold (e.g., $1,500), reserving negotiations only for major safety or environmental issues.
-
Appraisal Gap Coverage: In competitive submarkets, offering to cover an appraisal shortfall up to a specified limit (e.g., $5,000 to $10,000) provides sellers with confidence that your offer will close.
-
Flexible Possession Dates: If the sellers need time to find their next home or coordinate a school transition, offering a 14-day to 30-day post-closing occupancy (lease-back) agreement can make your bid stand out.
Strategic Playbook: What Sellers Can Do Differently This Week
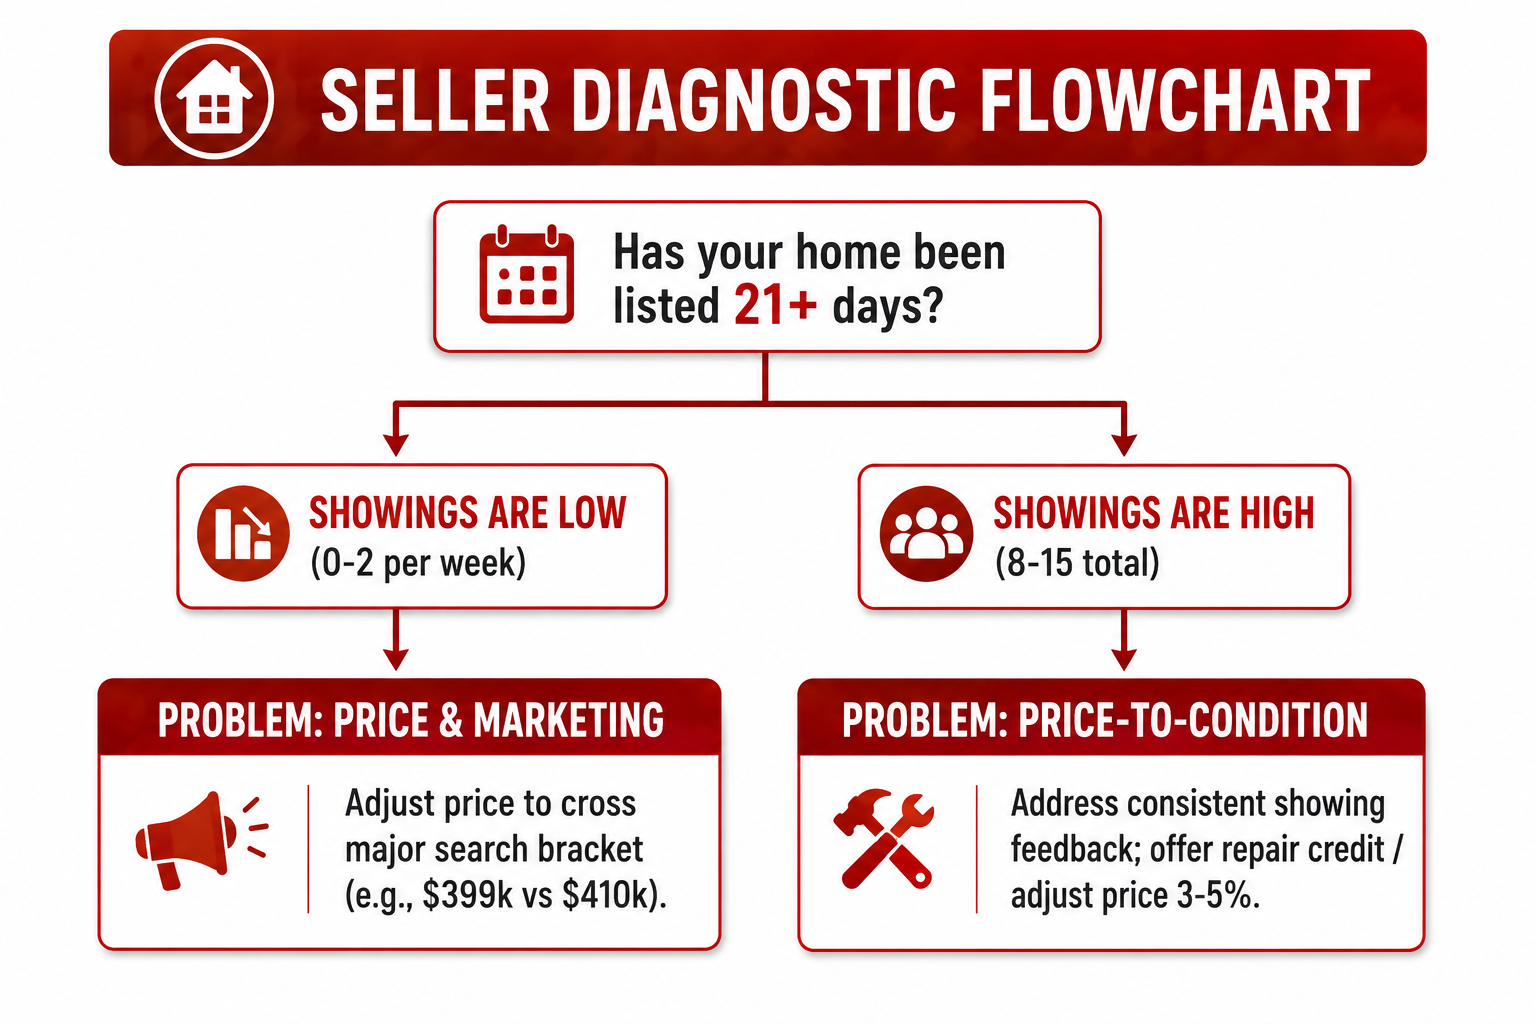
If your listing has been on the market for three or more weeks with showings but no written offers, the market is providing clear feedback. Here is how to regain momentum:
1. Execute a Decisive, Meaningful Price Adjustment
Minor price drops (such as reducing a $385,000 listing to $382,000) rarely re-energize a stagnant property. They do not trigger new portal alert algorithms and signal to buyers that the seller is reluctant to adjust to current conditions.
-
A price adjustment should be at least 3% to 5% of the listing value.
-
More importantly, ensure the adjustment crosses a meaningful psychological search boundary (for example, moving from $405,000 down to $394,900 to enter the sub-$400k search filter).
2. Address Show-Stopper Objections Directly
Review your showing feedback logs with your agent. If multiple buyers point out the same concern—such as an aging roof, pet odor, dark lighting, or an unfinished basement ceiling—do not dismiss it.
-
If a physical repair is cost-prohibitive, offer a clear seller credit or pre-paid home warranty in the MLS agent remarks.
-
For cosmetic concerns, invest a modest sum in professional deep cleaning, interior repainting in a neutral palette (such as warm white or light greige), and professional staging.
3. Consider Rate-Buydown Credits Over Price Cuts
If your home is listed at $350,000 and you are considering a $10,000 price drop to $340,000, consider this alternative:
-
Keep the list price at $350,000 and offer a $10,000 seller-paid closing credit toward a mortgage rate buydown (such as a 2-1 buydown or permanent point reduction).
-
A $10,000 price drop saves a buyer roughly $60 per month on their mortgage payment.
-
A $10,000 rate buydown can lower their interest rate by 1% to 2% during the first two years, saving them $200 to $350+ per month, making your property significantly more affordable than competing listings.
What St. Louis Real Estate Investors Should Watch
For residential real estate investors, landlords, and multi-family operators, late summer 2026 presents distinct acquisition conditions:
-
Multi-Family and Duplex Opportunities: As the single-family market remains competitive, 2-to-4 unit residential properties in Dutchtown, Tower Grove South, Benton Park West, and University City have seen longer days on market. Investors can acquire assets at cap rates between 7.0% and 8.5%, provided they underwrite appropriate reserves for capital expenditures.
-
The "Fix-and-Flip" Margin Squeeze: With renovation labor and financing costs elevated, flippers must be cautious with acquisition margins. In 2026, buyers will not pay top-of-market prices for rushed or superficial flips. Finishes, layout choices, and mechanical integrity must justify the exit price.
-
Rental Demand Stability: Sustained home prices and interest rates around 6.65% keep many would-be first-time buyers in the rental pool.
Key Takeaways for the Late Summer 2026 St. Louis Market
Navigating the current St. Louis real estate market requires moving past generalizations and looking at the specific data for your neighborhood and price point:
-
The Market Is Balanced, Not Broken: Single-family active inventory is up 15.2% year-over-year (3,563 listings), yet median prices have climbed 5.9% to $350,000.
-
Turnkey Homes Command a Premium: Buyers are paying more for move-in ready homes to avoid out-of-pocket renovation expenses at 6.65% mortgage rates.
-
Stale Listings Require Strategic Repositioning: If a listing sits for more than 21 days, the issue is almost always a mismatch between price, condition, and search bracket placement. Minor price cuts do not work; meaningful repositioning does.
-
Fall Momentum Starts Now: The weeks between late August and mid-October represent one of the most productive secondary windows in the St. Louis housing calendar before the holiday slowdown begins in November.
Whether you are seeking to secure your next home without overpaying or aiming to sell an existing property for maximum value, working with a knowledgeable, neighborhood-focused real estate advisor is essential to making confident, data-backed decisions.
Ready to Buy or Sell in St. Louis? House Sold Easy Has You Covered!
Whether you're thinking about listing your home or exploring a cash offer, it's worth understanding all of your options before making a decision. The right choice depends on your timeline, your property's condition, and your goals. Contact House Sold Easy to discuss your situation and see what makes the most sense for you.Our St. Louis experts know every corner of this city and will make buying your dream home or selling your high-end property a breeze. Don’t miss out on the hottest market in the U.S.! Contact House Sold Easy today and let’s make your real estate goals happen!