St. Louis Market 2026: 3 Must-Make Investor Adjustments
Sep 12, 2026
Written by David Dodge
Active residential listings across the St. Louis metropolitan area climbed 15.2% year over year to 5,850 units by late August 2026, marking the sharpest late-summer supply expansion eastern Missouri has seen since 2022, as tracked in the St. Louis REALTORS® & MARIS Monthly Housing Market Report. Concurrently, 17.9% of active properties on the Mid-America Regional Information System (MARIS) logged a price reduction during August, an increase of 1.1 percentage points over the same period in 2025, according to local market analysis from HousesSoldEasy.com on why St. Louis houses aren't selling. These metrics signal a fundamental change: available housing supply across the region is expanding faster than active buyer absorption.
For residential real estate investors, cash-flow operators, and private rehabbers active across the City of St. Louis, St. Louis County, St. Charles County, and Jefferson County, this dynamic alters standard underwriting models. Compounding the supply shift, Freddie Mac reported that the nationwide 30-year fixed mortgage rate reached 6.71% for the week ending September 3, 2026. The previous strategy of relying on aggressive bidding, automated 7% annual appreciation, and quick 90-day cash-out refinances at low borrowing rates no longer holds. Financing costs near 6.75% erode cash flow margins on speculative flips and increase holding costs on projects that sit unfinished on the market.
At the same time, regional rental demand remains steady. Zillow's August 2026 Market Report confirmed that St. Louis typical rents reached $1,443, growing 3.9% year over year, outpacing the modest 3.3% annual increase in regional home values. This divergence establishes a clear trend. The St. Louis market has divided into distinct transaction tracks where marketing velocity depends heavily on asset condition, submarket boundaries, and realistic cash-flow yields. Navigating the fourth quarter of 2026 requires updating acquisition parameters, rethinking exit strategies, and matching capital structures to verified local data.
Understanding this landscape begins with understanding eastern Missouri's fragmented geography. The St. Louis area contains separate municipal entities with independent zoning, differing property tax rates, and distinct housing styles. Century-old brick structures in the City of St. Louis perform differently than mid-century post-war frame houses in inner-ring County suburbs or modern master-planned subdivisions in St. Charles County. Investors who treat the metropolitan area as one uniform market risk making costly mistakes. Those who track the specific supply, pricing, and inventory differences between jurisdictions will find that rising inventory offers valuable acquisition opportunities.
Current St. Louis Market Context
The central theme across the St. Louis real estate landscape in September 2026 is market bifurcation. Transactions have separated into two clear operational tracks: turnkey, move-in-ready homes in sought-after school districts and older, deferred-maintenance properties that require capital investment.
In desirable St. Louis County municipalities such as Kirkwood, Webster Groves, and Ladue, turnkey homes sell in a median of 12 to 14 days. These properties draw buyers with strong credit, equity from prior sales, or dual corporate incomes. Families targeting school districts like Kirkwood R-VII or Webster Groves continue to compete for updated houses, occasionally producing multiple-offer situations that close near or slightly above asking price.
In contrast, properties needing repair or cosmetic modernizing across St. Louis County and the City of St. Louis average 44 days or more on the market. Many of these listings undergo several price cuts before securing a contract, while others expire without an offer. The average retail buyer is constrained by higher debt costs. When monthly payments are significantly higher than they were three years ago, buyers have less cash and little appetite for post-closing renovation projects. Houses with aging roofs, knob-and-tube wiring, galvanized plumbing, or outdated kitchens linger on MARIS, driving up average days on market and contributing to the metro-wide price reduction figures.
The direct cause of this divide is the cost of residential mortgages. Freddie Mac's primary mortgage market survey for early September 2026 placed the 30-year fixed-rate average at 6.71%, up 66 basis points from 6.05% in February. This increase has tightened household affordability across eastern Missouri. Financing a $250,000 purchase with 20% down now costs roughly $240 more each month than it did at the start of the year, reducing the maximum purchase price many local buyers can qualify for.
As a result, retail purchasers have become cautious about home inspections. The willingness of owner-occupants to take on major repairs after closing has fallen, shifting fixer-uppers into the investor purchase pool. Buyers who previously overlooked worn finishes to win a home in an active market now demand full inspection credits, contractor repairs, or interest rate buydowns to offset their monthly payments.
Broader St. Louis economic fundamentals, however, keep the region stable and prevent systemic loan defaults. Employment records tracked by the Federal Reserve Bank of St. Louis show solid payroll numbers across key sectors, including healthcare, aerospace, biotechnology, and higher education. Anchor institutions like BJC HealthCare, Mercy Health, Boeing Defense, and Washington University in St. Louis support a steady base of salaried jobs.
Metropolitan unemployment held at 4.1% through July 2026, ensuring that area residents remain employed and able to meet housing commitments. Steady local employment supports steady rental demand, especially as elevated mortgage rates lead aspiring buyers to rent single-family homes and duplexes in South City and inner-ring County communities.
Latest St. Louis Market Data
Mid-America Regional Information System (MARIS) data published by St. Louis REALTORS® highlights a clear rebalancing of supply and demand across eastern Missouri. Metro-wide active inventory grew from approximately 5,078 units in late summer 2025 to 5,850 units by late August 2026. This 15.2% inventory increase raised the region's absorption rate from 2.2 months of supply up to 2.8 months. While four to six months typically defines a balanced market, this jump represents the largest move toward equilibrium the St. Louis area has experienced in years.
Looking at individual submarkets shows clear differences across regional borders:
- St. Louis County: The median closed sales price for single-family residences reached $320,000 in July 2026, an 8.47% increase from $295,000 in July 2025. Conversely, active median listing prices dropped 13.76% to $250,000. This divergence indicates that higher-priced, turnkey suburban homes represent the bulk of completed transactions, while mid-tier and entry-level listings frequently require price drops to attract buyers. County-wide days on market averaged 23 days.
- City of St. Louis: The City operates as an independent county-level municipality with separate tax structures, municipal departments, and building codes. The median home value in the City stood at $225,000 in late August, while average time on market stretched to 38 days. City inventory sits at 3.6 months of supply, giving buyers and investors room to negotiate purchase prices, inspection repairs, and closing cost concessions.
- St. Charles County: West across the Missouri River, St. Charles County remains tighter than the urban core. The median sale price reached $365,000 in late summer 2026, with active inventory rising 9.8% year over year. Inventory stands at 2.1 months of supply, keeping average days on market low at 18 days.
The key metric indicating seller flexibility is the frequency of price adjustments. Zillow's August 2026 market figures recorded St. Louis median home values at $277,084, down 0.1% month over month. Furthermore, 17.9% of all active listings across the metro logged a price reduction during August.
In North St. Louis County areas like Florissant, Ferguson, and Hazelwood, and older South City neighborhoods like Dutchtown and Gravois Park, price reductions exceeded 22%. Sellers who entered the market with ambitious spring pricing have had to adjust their expectations to complete sales as autumn approaches.
Contract terms have also adjusted alongside pricing. The appraisal waivers, inspection waivers, and escalation clauses common from 2021 through 2023 are rare outside of premier suburban enclaves. Buyers are completing building inspections, environmental reviews, and sewer camera scopes. When inspection issues arise, buyers frequently request repairs or escrow credits. Sellers who decline to negotiate often see transactions fall through, returning their homes to the market where higher days on market make price cuts necessary.
St. Louis Active Housing Inventory Trend (2026)
The graph below details the monthly increase in active residential listings across the St. Louis metropolitan area over the first eight months of 2026, drawn from MARIS and local Realtor association data.
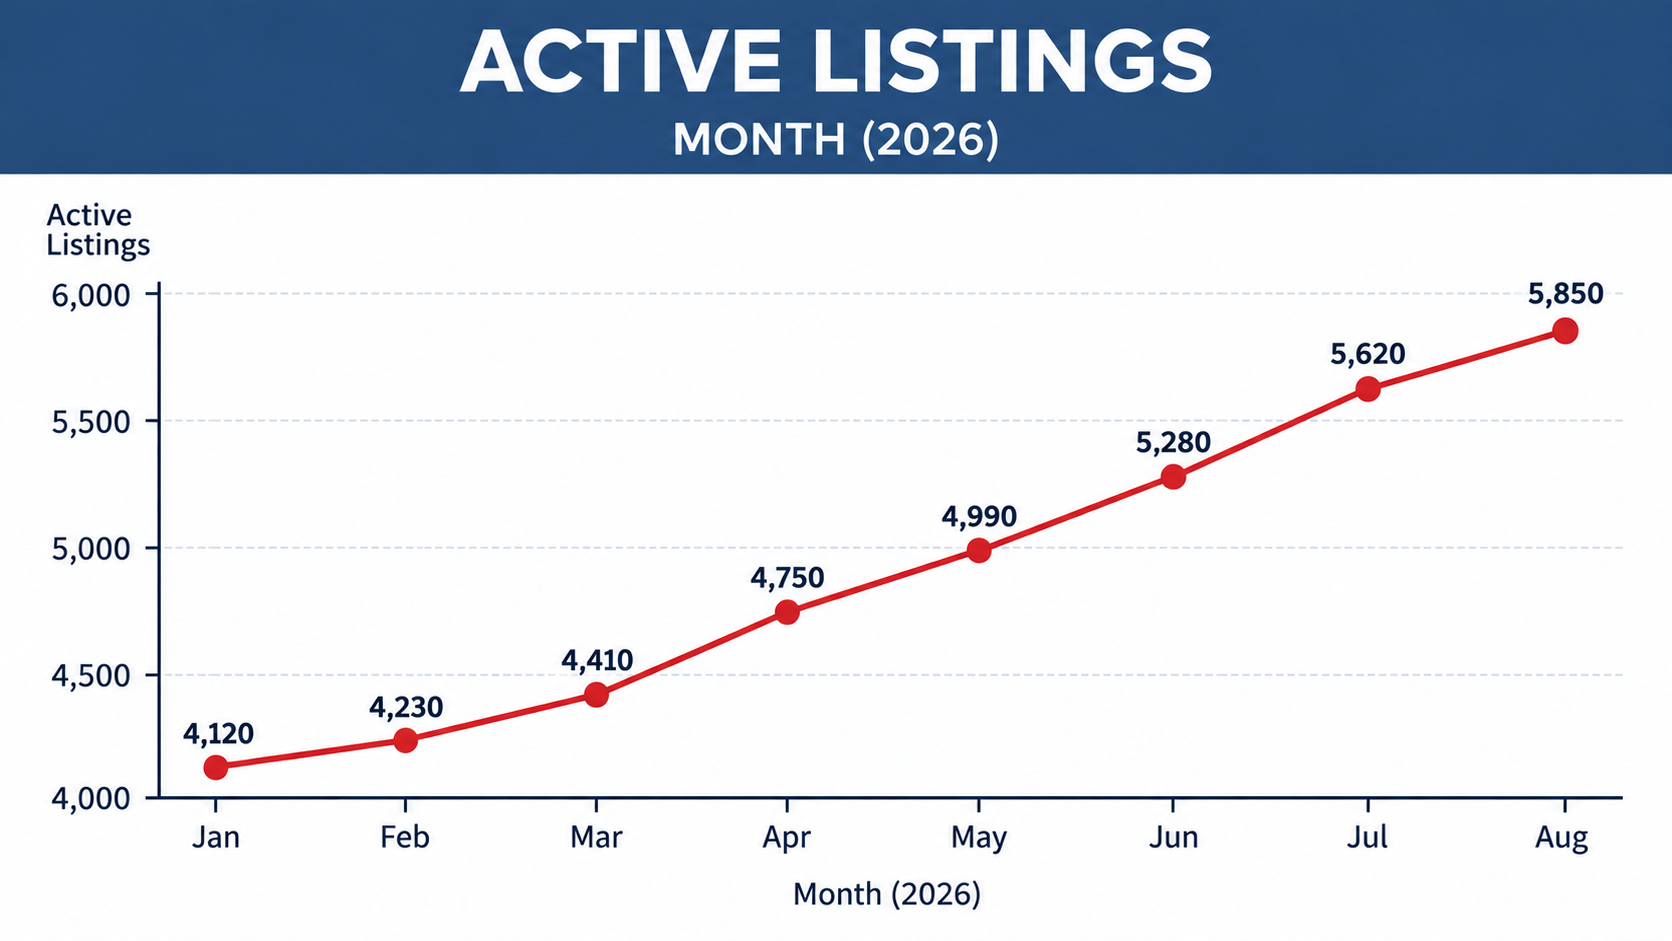
Graph 1 shows a steady increase in active listing volume across the St. Louis region during 2026, rising from 4,120 units in January to 5,850 units by late August. This represents a 42.0% expansion in available homes from the winter low point, running counter to the tight summer absorption patterns seen between 2021 and 2024. In those earlier years, strong seasonal demand drew down inventory numbers by mid-summer.
This inventory build demonstrates that organic market absorption has moderated under 6.71% mortgage rates. Properties that previously sold within three weeks are now remaining on the market into their second or third month. This inventory growth is driven primarily by slower sales velocity rather than a sudden surge of new construction. Homes take longer to sell, causing active listings to accumulate. This inventory backlog provides buyers and investors with time to conduct due diligence, compare neighborhood sales, and negotiate terms without the pressure of immediate bidding wars.
The continuous upward trend also changes negotiating leverage. In 2022, when regional inventory hovered near 3,500 units, sellers held considerable pricing power. Offers submitted below asking price or containing repair requests were frequently set aside for cleaner backup bids. With inventory approaching 6,000 units, real estate agents are advising sellers that longer market times reduce net returns. As homes sit past 30, 45, or 60 days, ongoing mortgage interest, property taxes, insurance, and maintenance costs reduce seller profits, opening the door for well-capitalized buyers to negotiate favorable purchase prices.
St. Louis Local Market Differences
A broad regional average conceals notable differences across St. Louis counties and municipal submarkets. Successfully evaluating deals requires examining each local area individually:
- City of St. Louis: The City market features historic neighborhoods, multi-family brick flats, and ongoing residential conversions. In areas like Tower Grove South, Shaw, Soulard, and the Central West End, rental properties and renovated homes continue to see steady interest. Two-to-four-family brick buildings in Tower Grove South regularly sell above $350,000, supported by rental demand from medical staff and graduate students connected to Saint Louis University and Washington University Medical Center. Walkable commercial strips, architectural character, and proximity to Forest Park and Tower Grove Park help support values in South City and the Central Corridor. In parts of North St. Louis City, including Walnut Park, Baden, and College Hill, vacancy rates remain higher, and marketing timelines often exceed 60 days. Citywide, the median home value closed August at $277,084, down 0.1% month over month per Zillow, indicating stable but flat pricing. City investors must account for local preservation guidelines, municipal occupancy permits, and structural maintenance on century-old brick buildings—such as masonry tuckpointing, flat roof coatings, and aging sewer lines—which require dependable contractors and realistic contingency reserves.
- St. Louis County: St. Louis County is the economic center of the metro area, containing 88 independent municipalities along with unincorporated communities. The County median single-family closed price of $320,000 reflects steady buyer activity in established suburban areas. Communities with well-regarded school districts—such as Kirkwood, Webster Groves, Clayton, and Ladue—continue to see quick sales for move-in-ready properties, typically under two weeks. These established neighborhoods benefit from central employment access and municipal services that help stabilize home values. In older post-war subdivisions across North County, including Florissant, Hazelwood, and Jennings, inventory has accumulated. In these areas, housing supply has reached 3.5 months, and homes needing mechanical or cosmetic updates often require multiple price reductions to find buyers. In South County communities like Affton, Mehlville, and Lemay, mid-century brick ranch homes offer affordable options for first-time buyers and rental property owners. Their standard floor plans and predictable construction make remodeling straightforward, avoiding the specialized trade costs often involved with historic City properties.
- St. Charles County: St. Charles County continues to draw buyers looking for newer homes, larger lots, and planned suburban neighborhoods in O’Fallon, St. Peters, and Wentzville. With a median sales price of $365,000 and 2.1 months of housing inventory, St. Charles is the most competitive quadrant in the region. Properties under $350,000 in the Fort Zumwalt and Francis Howell school districts still attract multiple offers, contrasting with the longer listing periods common in older City neighborhoods. Most homes in St. Charles County were built between the 1980s and the present day. These houses feature open layouts, two-car garages, modern electrical systems, and PVC plumbing, which reduce ongoing maintenance liabilities for landlords. While these subdivisions offer fewer opportunities for heavy value-add equity gains through renovation, they provide predictable, low-maintenance rental operations that appeal to long-term passive investors.
- Jefferson County and Franklin County: To the south and west, Jefferson and Franklin Counties offer distinct operational dynamics. In Jefferson County communities like Arnold, Imperial, and Festus, buyers find lower property tax rates and more flexible zoning regulations than in St. Louis County. This makes the area popular with commuters seeking larger lots, outbuildings, or small-scale multi-family duplexes. Franklin County, centered around Washington, Union, and Pacific, functions as a secondary exurban market where light industrial employment, local manufacturing, and small-town living keep home values stable. Properties in these outer counties linger slightly longer on the market when borrowing costs rise, but they offer attractive price points for budget-conscious buyers priced out of central St. Louis County.
St. Louis Regional Real Estate Market Snapshot (Late Summer 2026)
The table below outlines key housing metrics across primary St. Louis jurisdictions based on August 2026 MLS figures and local Realtor association data.
| Market Indicator | St. Louis City | St. Louis County | St. Charles County | St. Louis Metro Area |
|---|---|---|---|---|
|
Median Single-Family Closed Price |
$225,000 |
$320,000 |
$365,000 |
$277,084 |
|
Year-Over-Year Median Price Change |
+2.1% |
+8.47% |
+4.2% |
+3.3% |
|
Average Days on Market (DOM) |
38 Days |
23 Days |
18 Days |
26 Days |
|
Active Listing Volume (Units) |
1,420 Units |
2,890 Units |
1,120 Units |
5,850 Units |
|
Active Inventory Change (YoY) |
+16.8% |
+15.2% |
+9.8% |
+15.2% |
|
Months of Housing Supply |
3.6 Months |
3.16 Months |
2.1 Months |
2.8 Months |
|
Share of Listings with Price Cuts |
22.8% |
17.2% |
12.4% |
17.9% |
|
Median Single-Family Asking Rent |
$1,385 |
$1,550 |
$1,720 |
$1,443 |
Table 1 highlights the operational differences across eastern Missouri. The variation in marketing time and inventory absorption is clear: the City of St. Louis has 3.6 months of supply and an average marketing time of 38 days, while St. Charles County records 2.1 months of supply and sells in 18 days. This difference explains why listing price cuts are nearly twice as frequent in the City (22.8%) as in St. Charles County (12.4%).
For landlords and investors, the rental data illustrates cash-flow opportunities across urban and suburban settings. While St. Charles County commands the highest median rent ($1,720), its $365,000 median acquisition price generates a rent-to-price ratio of roughly 0.47%. In contrast, the City of St. Louis posts a median rent of $1,385 against a $225,000 median price point, yielding a rent-to-price ratio of 0.61%. Select South and North City rental pockets exceed 0.75%. Investors prioritizing monthly cash flow will find stronger returns in the City and mature County suburbs, while buyers focused on newer construction and lower initial maintenance often favor St. Charles County.
Tax differences also influence these figures. St. Louis County includes dozens of separate municipal tax rates, school district levies, and special taxing districts that can produce varying property tax bills on homes of similar size. A home in University City or Maplewood can carry higher annual taxes than an equivalent property in unincorporated South County or St. Charles County. When calculating debt service coverage at 6.71% interest, property tax variations can directly affect loan approval amounts and required equity down payments.
What This Means for St. Louis Buyers
Homebuyers across the St. Louis area have gained negotiating leverage heading into autumn 2026, though borrowing costs require careful planning. With 30-year fixed rates averaging 6.71%, purchasing power remains tight. However, the expansion to 5,850 active listings provides buyers with more choices and removes the rushed bidding environments of earlier years.
Buyers targeting the City of St. Louis or mature inner-ring County suburbs like Affton, Crestwood, and Overland should look closely at properties that have spent more than 30 days on MARIS. On these listings, purchasers can negotiate price adjustments or seller-paid closing credits. Rather than requesting simple price reductions, buyers can ask sellers for credits to fund a 2-1 temporary interest rate buydown.
Securing a 2% concession on a $300,000 purchase reduces the initial year's effective interest rate to 4.71%, lowering monthly principal and interest payments from $1,938 to roughly $1,558. This strategy helps buyers manage monthly costs during their initial years of ownership while preserving cash reserves for moving expenses or home updates.
Buyers should maintain standard inspection contingencies, particularly on older homes. Housing stock across the City of St. Louis and older County municipalities often contains aging components, such as cast-iron drain lines, clay sewer pipes, outdated electrical wiring, or aging roofs. With homes in the City averaging 38 days on market, sellers are more inclined to address structural defects or offer closing credits rather than let a sale fall through and re-list the property.
Buyers can also seek out sellers managing life transitions, such as corporate relocations, estate settlements, or landlords selling off rental inventory. These owners often prioritize closing speed and certainty over holding out for top dollar. A clean offer paired with a local lender pre-approval letter and a clear 30-day closing timeline can often secure a purchase below asking price on properties that have crossed 45 days on market.
What This Means for St. Louis Sellers
For homeowners listing properties in St. Louis this September, the main challenge is setting aside peak pricing expectations from 2023 and 2024. Active listing prices across St. Louis County fell 13.76% year over year in late August, even as closed sales prices held steady. This pattern emerges when sellers list properties at ambitious prices, encounter limited buyer interest, and subsequently implement price cuts to reach an agreement.
To avoid lingering on the market past 30 days—when buyer showings drop off—sellers must price carefully from day one. Comparative market analyses should rely on hyper-local closed sales from the past 60 days rather than older peak-spring comps.
In submarkets like Florissant, South City, and Maryland Heights, properties launched at full retail pricing with unaddressed cosmetic updates risk joining the stagnant listing pool. If a home receives few private showings during its first ten days on MARIS, the seller should consider a 4% to 6% price adjustment before reaching day 21, rather than letting the listing go stale.
Sellers can also attract interest by offering financing credits in their MLS listings. Promoting a "Seller credit toward buyer interest rate buydown" often appeals to rate-conscious buyers more than a standard price cut. For example, a $7,500 financing concession on a $280,000 listing delivers meaningful monthly savings to a financed purchaser compared to dropping the listing price to $272,500, preserving the property's headline value while widening the buyer pool.
Preparing a home before listing remains essential. With regional inventory up 15.2%, buyers have more options and tend to notice deferred maintenance. Low-cost updates like fresh interior paint, updated lighting, serviced HVAC equipment, and clean landscaping help remove common buyer concerns. Completing pre-listing municipal and private home inspections can also streamline the contract-to-close period by addressing repair items upfront and reassuring potential buyers.
What St. Louis Real Estate Investors Should Watch
Real estate investors, wholesalers, and single-family rental operators must adapt their business practices to current borrowing costs. The era of high-leverage value-add investing—built on 5.0% refinance rates and rapid market appreciation—has shifted. Operating successfully in late 2026 requires steady cash flow underwriting, disciplined offer pricing, and sound capital reserves.
Adjustment 1: Shift from "Acquire at Any Cost" to "Acquire at the Right Price"
With regional active listings expanding 15.2% and 17.9% of homes taking price cuts, acquisition criteria should reflect changing market leverage. Investors should refine their Maximum Allowable Offer (MAO) models by applying a 5% market adjustment discount to older, long-DOM properties.
The traditional formula:
MAO = (After Repair Value x 0.70) - Rehab Costs
Should now incorporate realistic holding costs and financing margins:
MAO = (ARV x 0.70) - Rehab - Financing Buffer (6.75%+) - Market Adjustment Factor (5%)
On properties that have been on MARIS for more than 45 days in rental corridors—such as North County (Florissant, Hazelwood) and South City (Benton Park West, Gravois Park)—investors can submit offers at 80% to 85% of asking price, supported by cash or verified private financing. The goal is to provide solutions for sellers burdened by ongoing holding costs or problematic rental management, turning marketing time into favorable equity margins.
Adjustment 2: Pivot from "Flip Fast" to "Hold for Cash Flow"
Retail flip exit timelines have lengthened. Houses needing cosmetic or mechanical updates average 44 days on market, increasing carrying costs—including insurance, utilities, property taxes, and loan interest—which trims gross margins.
At the same time, single-family rental metrics across the St. Louis metropolitan area continue to perform well, with rents climbing 3.9% year over year to a median of $1,443, according to Zillow's August 2026 research. CoStar's multifamily analysis confirms asking apartment rents reached $1.51 per square foot, up 1.6% annualized. Furthermore, Apartments.com market updates show Midwest rental expansion at 2.3%, leading the country in rent stability.
Investors should run dual underwriting on every potential deal: evaluate both the retail flip margin and the long-term rental yield. If a property can achieve a stabilized Debt Service Coverage Ratio (DSCR) above 1.25x with 6.75% financing, retaining it as a rental can offer solid, risk-adjusted returns heading into the winter months.
Adjustment 3: Build a 12–24 Month Capital Strategy
Investors using the BRRRR (Buy, Rehab, Rent, Refinance, Repeat) model should anticipate longer refinancing timelines. Expecting a rapid cash-out refinance at 5.5% within 90 days of project completion is not realistic under current market conditions. Regional lenders—such as Commerce Bank, Enterprise Bank & Trust, and area credit unions—regularly look for minimum DSCR ratios of 1.25x on investment refinances.
Underwrite prospective acquisitions with terminal interest rates between 6.75% and 7.25% across a two-year holding period. Maintain six months of principal, interest, taxes, and insurance (PITI) reserves for each active door. This cash cushion helps protect the portfolio against unexpected repair items or tenant vacancies, giving the owner breathing room as equity builds.
Creative financing structures can also help bridge transaction gaps. On listings with extended days on market, some sellers may consider seller financing, subject-to arrangements, or lease-purchase options. An investor who structures a 10% to 20% seller second-lien note at 5.0% interest lowers the overall cost of debt, reduces upfront cash requirements, and helps meet lender coverage minimums. These creative financing tools allow investors to close deals without relying entirely on traditional commercial loan products.
What Just Happened in St. Louis
During early September 2026, several key economic and housing reports provided fresh perspective on the St. Louis real estate market:
- Mortgage Rate Adjustments: On September 4, Freddie Mac released its Primary Mortgage Market Survey showing the 30-year fixed mortgage average at 6.71% for the week ending September 3. Rising from 6.05% in February, this increase marks the highest borrowing level since July 2025, cooling buyer urgency across the Midwest.
- August Housing Data: St. Louis REALTORS® and MARIS published complete July/August figures in early September, showing regional active inventory at 5,850 homes—a 15.2% year-over-year increase. Concurrently, 17.9% of active properties logged a price reduction by late August, reflecting rising seller concessions.
- Home Values & Rental Trends: On September 8, Zillow released its August 2026 market update, reporting the typical St. Louis home value at $277,084 (down 0.1% month over month, up 3.3% year over year). Single-family rents grew 3.9% annually to $1,443 per month. CoStar’s September 3 update showed apartment asking rents across the St. Louis metro flatlining at $1.51 per square foot, representing a 1.6% yearly gain.
- Federal Rent Standards: On September 1, HUD published its Fair Market Rents (FMR) schedule for Fiscal Year 2027. The St. Louis metropolitan baseline two-bedroom Fair Market Rent increased from $1,218 to $1,349, a 10.8% rise that supports Section 8, housing providers, and urban rental investors.
These developments demonstrate that St. Louis is maintaining its historical stability relative to the wider country. While faster-growing Sunbelt markets are managing significant new multi-family and single-family construction that has softened pricing, St. Louis exhibits steady, measured changes. Supply growth in St. Louis has been gradual, and rental occupancy has remained consistent. Rather than seeing sharp price drops, the region is experiencing a standard market rebalancing that favors disciplined, well-prepared buyers.
What Could Be Released Next
As the second week of September concludes, local market participants should monitor several scheduled economic updates:
- MARIS Mid-Month Inventory Snapshot: Scheduled for mid-September 2026, MARIS will release preliminary September listing and contract numbers. This update will show whether the late-August inventory increase extends into early autumn or if back-to-school routines bring a seasonal slowdown in new listings.
- St. Louis County Land Tax Sale: The St. Louis County Sheriff's Department and county revenue collectors are conducting their post-Labor Day judicial land tax sales. These public auctions feature tax-delinquent properties across unincorporated County areas and older municipalities, offering opportunities for local rehabbers seeking development parcels or historic renovation projects.
- Freddie Mac Mortgage Survey: Scheduled for Thursday, September 17, 2026, Freddie Mac will publish its next weekly rate report. Investors will watch to see if the 30-year fixed benchmark holds above 6.70% or moves back toward the mid-6% range.
- Bureau of Labor Statistics Regional Report: Slated for late September, the BLS will publish updated metropolitan employment and wage figures for August 2026. These numbers will show whether St. Louis wage gains are keeping pace with local housing costs and living expenses.
Keeping an eye on these scheduled reports allows market participants to refine their plans early. For instance, if mid-month MARIS figures show an uptick in contract cancellations, investors can anticipate more motivated sellers heading into October. Buyers and wholesalers can then tailor their outreach to owners whose previous transactions fell through due to financing issues.
What to Watch During September 2026
Heading into late September, buyers, sellers, and portfolio operators should keep an eye on several key indicators:
- Absorption of Value-Add Inventory: Track whether days on market for older properties continue to exceed 45 days. If marketing times lengthen, the share of price reductions could climb from 17.9% toward 20% by October, creating more room to negotiate for cash-ready purchasers.
- Turnkey Suburban Velocity: Watch whether move-in-ready listings in high-demand school districts such as Kirkwood, Webster Groves, Parkway, and Rockwood maintain their 12-to-14-day sales pace. Any slowdown in these core suburban areas would indicate that financing costs are beginning to outweigh trade-up buyer demand.
- Section 8 Lease Alignments: With HUD’s FY2027 Fair Market Rents increasing the two-bedroom rate by 10.8% to $1,349, rental owners in South and North St. Louis City should review their tenant placement strategies. Working with housing choice voucher programs can offer reliable, direct-deposit rental income that buffers against broader market changes.
- Commercial Lending Criteria: Monitor commercial lending guidelines closely. If regional banks increase debt service coverage requirements from 1.20x to 1.30x on non-owner-occupied properties, investors will need larger equity contributions when purchasing multi-family or commercial-residential properties.
- Municipal Code Compliance and Occupancy Inspections: Municipalities across St. Louis County—such as Florissant, University City, and Ferguson—continue to enforce exterior property standards and occupancy requirements. Buyers taking on fixer-uppers must confirm municipal repair escrow amounts, as these funds remain tied up until final municipal sign-offs are completed.
Step-by-Step Investor Implementation Guide
To apply these market findings directly, investors can follow this four-week planning sequence:
- Week 1 (Underwriting Audit): Update deal analysis spreadsheets using a 6.75% interest rate baseline and a 1.25x DSCR minimum. Apply a 5% market adjustment discount to MAO models on all active target listings that have spent more than 30 days on MARIS. Stress-test all prospective deals against standard operating assumptions, including 10% maintenance reserves, 8% property management fees, and a 5% vacancy allowance.
- Week 2 (Pipeline Triage): Assess rehabilitation properties scheduled for completion in late 2026. If estimated flip margins have tightened to under 10% of After Repair Value (ARV) due to longer market times, analyze keeping the home as a long-term rental. Weigh the cash proceeds from an immediate sale against the tax benefits, depreciation, and ongoing cash-on-cash returns of a rental hold using current $1,443 average rents.
- Week 3 (Capital Alignment): Meet with commercial loan officers at regional banks and local credit unions—such as Commerce Bank, Enterprise Bank & Trust, and Midwest BankCentre. Discuss their balance-sheet lending guidelines, rate-lock terms, and interest-only options for investment properties. Confirm verified 6-month PITI liquidity reserves for every active unit across the portfolio to safeguard operations.
- Week 4 (Focused Prospecting): Set up daily searches on MARIS for single-family homes and small multi-family buildings that have been active for 45 days or more across core investment areas: Tower Grove South (63116), Affton (63123), Florissant (63136), and University City (63130). Look for listings with prior price cuts. Submit offers emphasizing closing certainty, concise inspection periods, and flexible closing dates to solve problems for motivated sellers.
Key Takeaways
The St. Louis real estate market of September 2026 is experiencing an orderly transition. With active inventory expanding 15.2% to 5,850 units and 30-year mortgage rates holding near 6.71%, market leverage has moved away from aggressive sellers. As price reductions reach 17.9% across the metro area and marketing times average 38 days in the City of St. Louis, real estate decisions must be guided by verified local data rather than national commentary.
For homebuyers and long-term investors, the remainder of 2026 offers an opportunity to buy properties without the intense bidding of past cycles. By sticking to clear underwriting standards, focusing on homes that have spent more than 30 days on the market, negotiating temporary rate buydowns, and benefiting from single-family rent growth (up 3.9% year over year), buyers can build dependable long-term equity.
Sellers must price their properties based on recent 60-day closed comps rather than aspirational peak prices. In this shifting market, success belongs to those who follow the data, build flexible financing relationships, and execute steadily in their chosen St. Louis neighborhoods.
Ready to Buy or Sell in St. Louis? House Sold Easy Has You Covered!
Whether you're thinking about listing your home or exploring a cash offer, it's worth understanding all of your options before making a decision. The right choice depends on your timeline, your property's condition, and your goals. Contact House Sold Easy to discuss your situation and see what makes the most sense for you.Our St. Louis experts know every corner of this city and will make buying your dream home or selling your high-end property a breeze. Don’t miss out on the hottest market in the U.S.! Contact House Sold Easy today and let’s make your real estate goals happen!