St. Louis BRRRR Strategy: Making Deals Work at 6.7% Rates
Sep 10, 2026
Written by David Dodge
The BRRRR method—Buy, Rehab, Rent, Refinance, Repeat—has served as an engine for building residential wealth across the St. Louis metropolitan area for well over a decade. However, the macroeconomic environment dictating local deal math in September 2026 is fundamentally different from the four-percent debt era that defined previous investing cycles. According to the Freddie Mac Primary Mortgage Market Survey reported on September 4, 2026, the average 30-year fixed-rate mortgage reached 6.71% for the week ending September 3, placing immediate pressure on real estate operators throughout the St. Louis region.
At a 6.71% baseline borrowing cost, conventional refinance underwriting no longer forgives undisciplined acquisitions, inaccurate post-renovation valuations, or sluggish rent-up schedules. For years, investors throughout the region could acquire brick two-family flats in Tower Grove South or post-war frame houses in Affton, perform cosmetic rehabilitations, and systematically extract 100% of their invested capital while enjoying comfortable monthly operational margins. Today, higher baseline interest rates, stringent appraisal reviews, and rising property insurance and municipal compliance costs have introduced acute friction into the cash-out refinance phase.
If you continue operating with stale financial models, you risk getting trapped in the fourth leg of the cycle. Deals that look acceptable on paper during initial due diligence can quickly become illiquid capital traps when commercial debt-service requirements restrict cash-out loan proceeds. However, seasoned investors across St. Louis City and St. Louis County are not abandoning the BRRRR framework—they are restructuring it. Succeeding in the current climate requires discarding generic real estate formulas and adopting hyper-local underwriting standards. By structuring multi-path exit strategies, targeting resilient rental submarkets, and establishing relationships with regional portfolio balance-sheet lenders, real estate investors can continue executing profitable BRRRR projects throughout the St. Louis area.
Current St. Louis Market Context
Understanding the broader market backdrop is essential before deploying capital into local value-add real estate. The St. Louis metropolitan real estate market in September 2026 is characterized by pronounced neighborhood-level bifurcation. According to regional market tracking from MARIS and local market analyses, total active residential inventory across the St. Louis Metro reached 5,850 units in August 2026, representing a 15.2% year-over-year increase. This inventory expansion gives buyers and investors a broader selection of homes than during the inventory troughs of recent years, but it also alters competitive dynamics during the back-end resale and appraisal phases.
Sellers across the metro area are actively adjusting their expectations. By mid-August 2026, 17.9% of active St. Louis listings had recorded at least one price cut, reflecting an increase of 1.1 percentage points over August 2025. Meanwhile, broad price appreciation has plateaued. As documented in the Zillow August Market Report indicated that the St. Louis metro median home value stood at $277,084, reflecting a modest 0.1% month-over-month decline. This stabilization in home prices directly impacts forced-appreciation underwriting; investors can no longer count on passive market appreciation to compensate for renovation cost overruns or miscalculated after-repair values.
On the rental side of the equation, regional fundamentals remain stable but split cleanly by property type. Industry analysis from CoStar showed that apartment rents flatlined across the St. Louis area, recording a modest 1.6% year-over-year increase to an average of $1.51 per square foot. In contrast, detached single-family rental properties displayed stronger pricing power, posting a 3.9% year-over-year rent increase to reach a metropolitan average of $1,443 per month. For BRRRR operators, single-family resilience is a vital data point, as strong gross rents directly protect the debt service coverage ratios required to qualify for long-term take-out financing.
Financing conditions remain the single largest hurdle facing regional operators. The benchmark 30-year fixed rate of 6.71% published by Freddie Mac represents the highest borrowing cost recorded since July 2025. For small residential rental investors securing takeout financing through conventional Fannie Mae loans or non-recourse Debt Service Coverage Ratio (DSCR) investor programs, note rates regularly land between 7.25% and 8.00%. Consequently, monthly principal and interest obligations consume an expanded share of gross collected rents, constraining allowable loan amounts and reducing the percentage of initial capital that investors can pull back out.
Latest St. Louis Market Data
A granular examination of marketing velocity highlights the distinct operational divide across regional housing stock. In late August 2026 reports, residential listings across the St. Louis metropolitan area spent an average of 26 days on market before securing an executed contract. However, broad regional averages mask the practical conditions facing buyers and renovators on the ground. When evaluating velocity by property condition and geographic submarket, the regional market separates into two opposing tracks.
Track 1 consists of turnkey, renovated properties located in premier municipal school districts across inner-ring St. Louis County communities, such as Kirkwood and Webster Groves. In these sought-after pockets, move-in-ready single-family homes often enter contract within 12 days. Strong owner-occupant demand, supported by high household incomes, continues to absorb quality inventory despite elevated borrowing costs. Conversely, Track 2 encompasses distressed properties and aging houses with deferred maintenance. These project assets sit on the market for an average of 44 days or more across the metro area, with neglected properties in older urban pockets frequently lingering past 60 days.
This bifurcation creates distinct opportunities and hazards for BRRRR investors. When acquiring distressed properties in Track 2, investors benefit from reduced buyer competition, motivated sellers, and substantial room to negotiate pricing and repair credits. However, once the renovation is finished, the newly completed asset must undergo appraisal scrutiny.
Appraisers operating throughout St. Louis City and St. Louis County are exercising notable caution. Because closed comparable sales reflect price stabilization, appraisers are examining material choices, mechanical system ages, functional layouts, and neighborhood boundary lines far more strictly than in past years. Successfully completing a BRRRR deal requires underwriting conservative post-renovation values to prevent appraisal shortfalls at refinance.
PRIMARY ST. LOUIS MARKET TREND
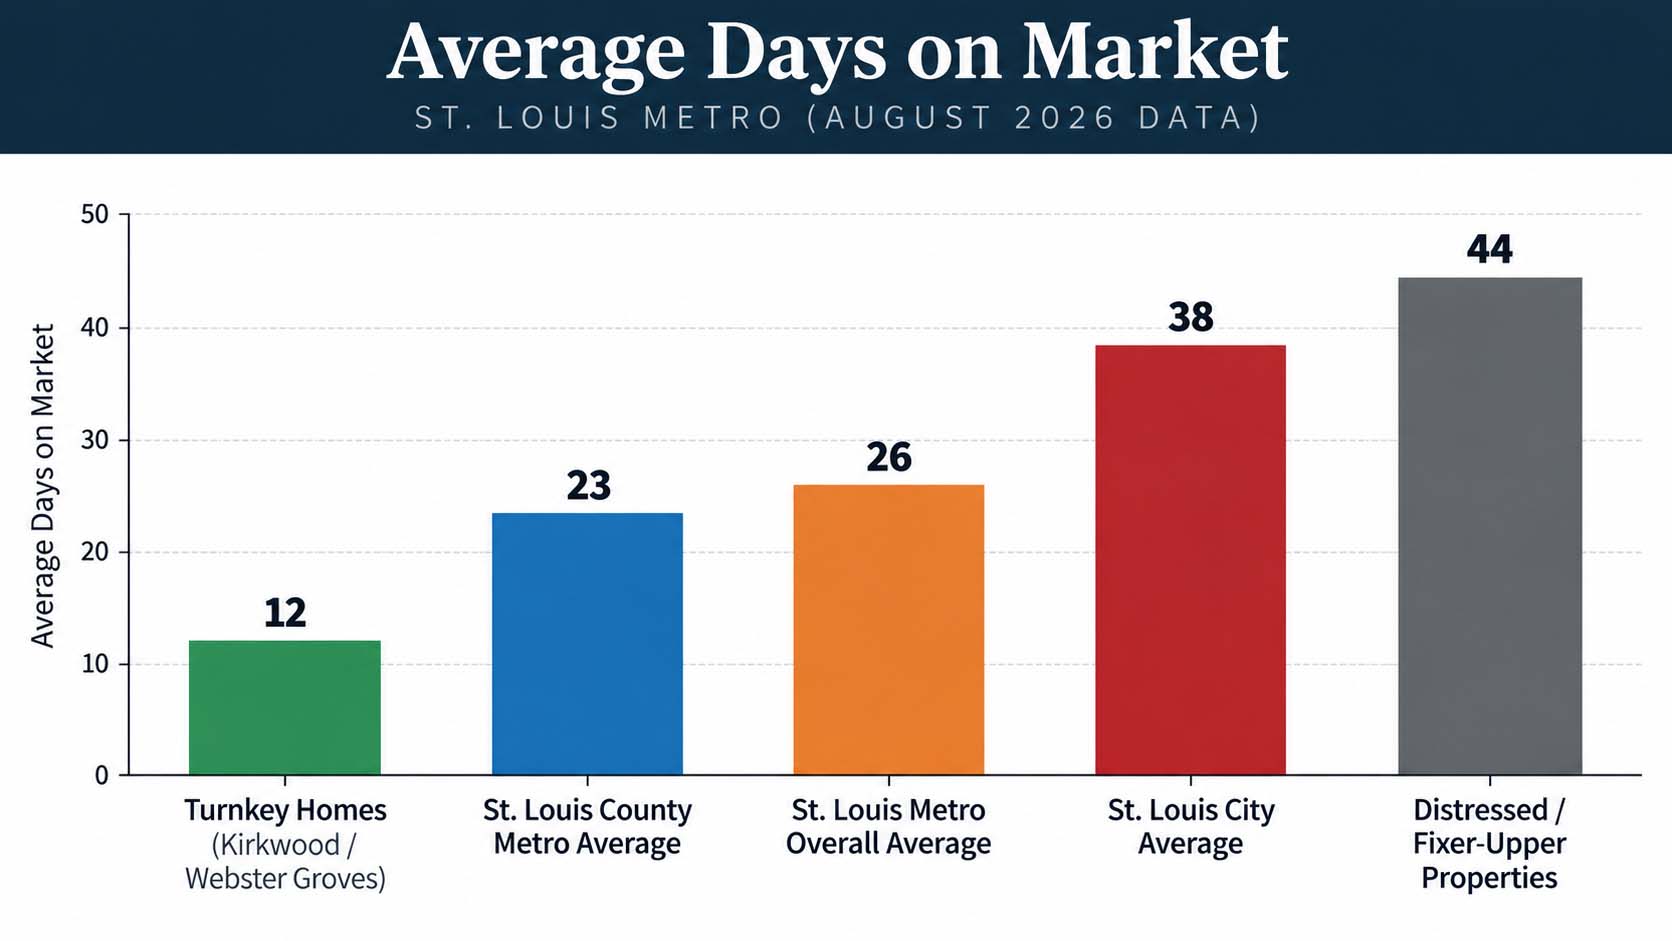
The graph illustrates the sharp divergence in transaction velocity across the St. Louis region during August 2026. Turnkey homes in prime municipal submarkets trade in just 12 days, demonstrating that qualified buyers will move quickly for modern finishes in proven locations. In contrast, distressed inventory averages 44 days on market across the metro area, while St. Louis City listings average 38 days before securing a buyer.
For BRRRR investors executing the initial acquisition phase, this velocity spread provides valuable leverage. Properties within the 44-day distressed category allow investors to submit discounted cash or hard-money offers, request extended inspection periods, and negotiate seller credits for major repairs. However, when building the stabilization timeline, investors must budget for realistic marketing times. Expecting an urban property to lease and refinance within 30 days of completion is overly optimistic when urban listings take nearly 40 days to absorb. Adding extra holding costs into your pro forma protects project liquidity.
St. Louis Local Market Differences
Executing a successful BRRRR project in the St. Louis region requires navigating distinct municipal rules, tax environments, and building styles. The area is politically and geographically fragmented, meaning underwriting standards that succeed in St. Louis County can lead to losses if applied without adjustment in St. Louis City.
St. Louis City offers historic architectural character, featuring brick masonry construction, full basements, and multi-family configurations in neighborhoods like Tower Grove South, Shaw, Benton Park, and Lafayette Square. However, historic homes carry substantial renovation variability. Structures built prior to 1950 regularly require full electrical rewiring, lateral sewer line replacements, updated plumbing stacks, and exterior masonry tuckpointing.
City investors must also account for municipal permitting processes and local real estate transfer taxes. In addition, rental income in St. Louis City varies significantly block by block. In established urban corridors like Tower Grove South (63116), renovated three-bedroom homes rent for $1,500 to $1,700 per month, supported by walkable business districts, parks, and nearby medical centers. In contrast, comparable homes located north of Delmar Boulevard or in secondary urban areas experience longer tenant turnover times and higher vacancy rates, which directly threatens the debt-coverage ratios required for takeout loans.
St. Louis County presents a different operational profile. Comprising dozens of incorporated municipalities alongside unincorporated areas, the County features diverse regulatory and property tax frameworks. In established inner-ring communities like Affton (63123) and Crestwood, post-war brick ranches and mid-century bungalows feature predictable floor plans, reliable infrastructure, and strong school options. Acquisition pricing for fixer-uppers in these neighborhoods typically lands between $180,000 and $210,000, with after-repair values reaching $260,000 to $290,000.
Because tenant demand for single-family rentals in these submarkets is steady, monthly rents range from $1,400 to $1,650, supporting consistent occupancy. However, St. Louis County properties undergo regular reassessments, and numerous municipalities enforce strict occupancy inspections before a tenant can move in. Overlooking municipal compliance can delay occupancy and prolong expensive interim financing.
Further west in St. Charles County, covering cities like St. Peters, O’Fallon, and Wentzville, housing stock is significantly newer, generally dating from the 1980s onward. Renovation scopes in these areas are more predictable, focusing on cosmetic updates, HVAC maintenance, and roof replacements rather than historical remediation. While purchase prices are higher—often exceeding $300,000 for distressed properties—renovated homes sell and lease rapidly to well-qualified tenants. However, tighter rent-to-price ratios in St. Charles County make complete cash-out refinances difficult, often requiring investors to keep additional equity in the property.
In southern areas like Jefferson County (including Arnold and Imperial), lower purchase prices offer accessible entry points for newer investors. However, properties often rely on private septic systems and well water, requiring specialized inspections. Rental growth in peripheral markets has lagged behind the urban core, meaning forced equity must stem entirely from physical property improvements rather than general market movement.
ST. LOUIS COMPARISON
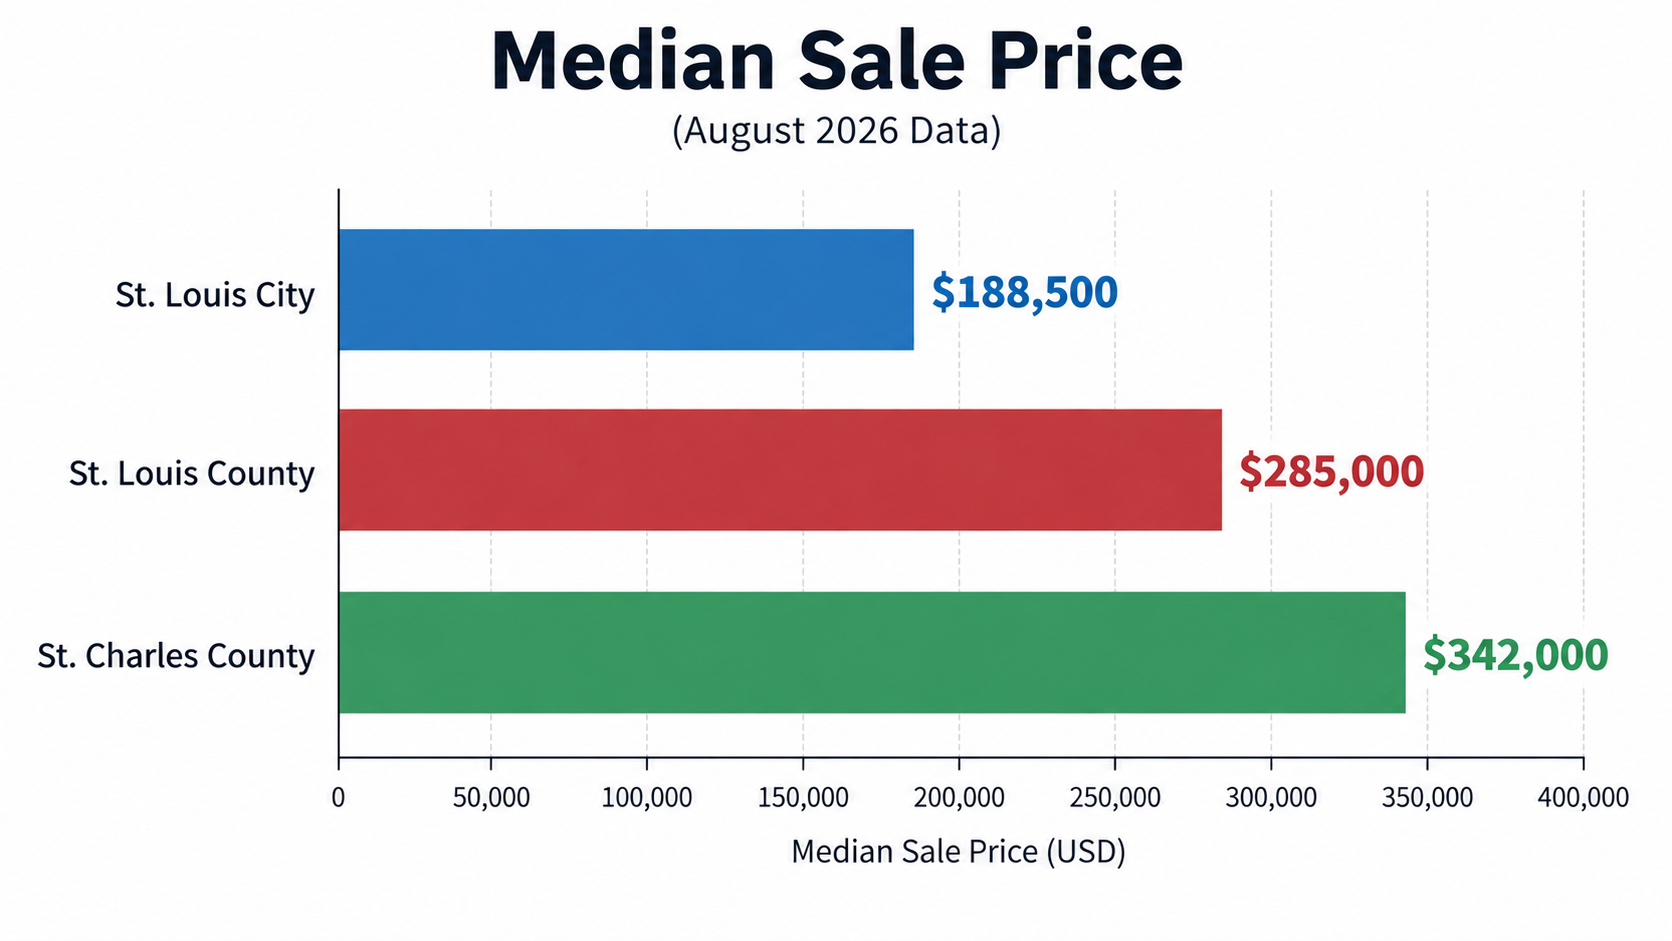
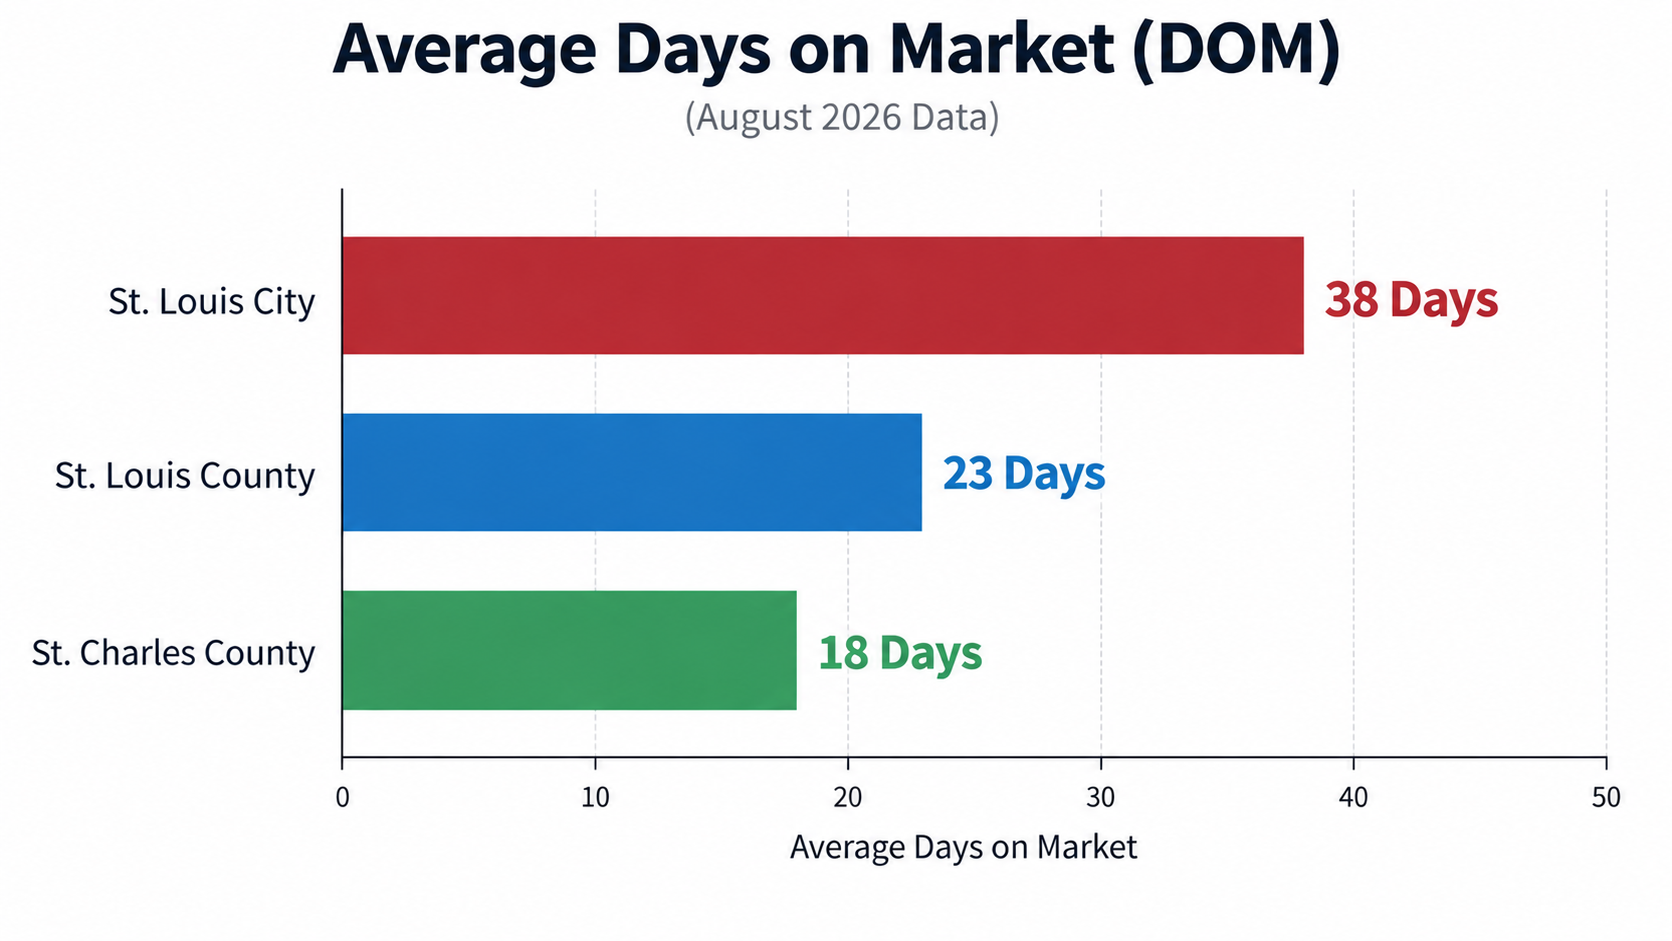
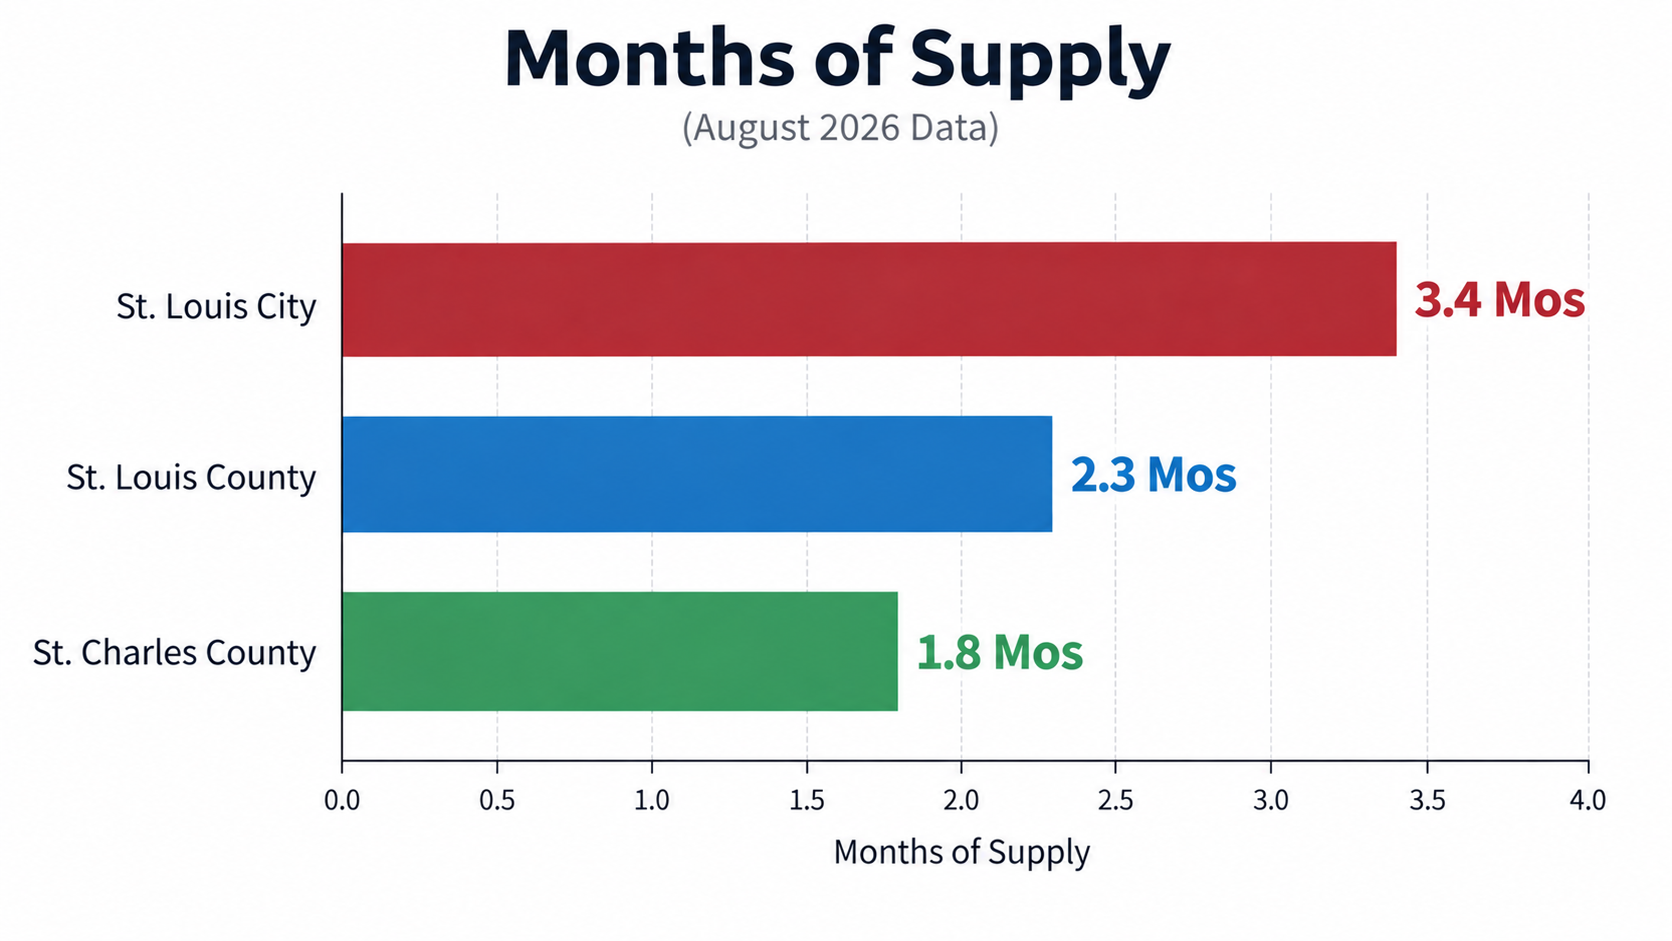
Graph outlines key housing metrics across St. Louis City, St. Louis County, and St. Charles County as of August 2026. The data illustrates why blanket underwriting assumptions fail across regional borders. In St. Louis City, a median sale price of $188,500 offers an affordable entry barrier, but listings spend an average of 38 days on market, and supply stands at 3.4 months. This necessitates budgeting for longer holding periods during the rehab and leasing stages.
In contrast, St. Charles County maintains tighter supply at 1.8 months and an 18-day average market duration, but its higher median sale price of $342,000 requires greater initial equity. St. Louis County occupies a middle tier, with a median price of $285,000, an average marketing time of 23 days, and 2.3 months of supply.
For BRRRR investors, St. Louis County regularly provides the most reliable combination of tenant pool depth, steady single-family rent rates, and exit liquidity. However, operators must account for internal micro-market variations: an asset in the Kirkwood School District behaves far differently from one in unincorporated North County or Mehlville.
What This Means for St. Louis Buyers
For buyers seeking value-add properties to renovate and hold, the September 2026 market offers clear strategic advantages alongside financing risks. With metro active inventory reaching 5,850 units, investors no longer face the intense bidding wars that characterized earlier years. Due diligence rights, structural inspection contingencies, and lateral sewer scopes can—and should—be included in purchase contracts, especially for older brick residences in St. Louis City and inner-ring suburbs.
However, elevated financing costs demand strict underwriting discipline. With standard mortgage rates at 6.71% and short-term construction financing carrying rates between 10% and 12%, buyers must avoid overpaying on acquisition. Distressed homes lingering beyond 30 to 45 days on the market present opportunities to negotiate direct price discounts or seller closing credits to offset initial outlays.
Buyers should target properties with solid structural bones—sound foundations, modern electrical panels, and reliable roofs—where capital can be deployed into high-return interior updates. In neighborhoods like Affton, Florissant, and Tower Grove South, creating functional living area by finishing lower levels or opening outdated kitchen layouts builds appraisal equity. Acquirers must verify that their total basis (purchase price, renovation budget, and carrying costs) remains at or below 70% to 75% of conservative closed comps from the past 90 days.
What This Means for St. Louis Sellers
Sellers of outdated or distressed properties across the St. Louis area must recognize the shift in market conditions. The period where buyers would pay premium prices for properties with deferred maintenance has closed. With 17.9% of active listings executing price cuts in August, property owners who list outdated homes at turnkey prices face extended market times, often exceeding 40 to 60 days.
For sellers seeking an as-is sale without taking on costly renovations, realistic pricing from the start is essential. Setting a list price based on peak 2024 comparable sales leads to stagnant listings that buyers eventually discount. Sellers must also recognize that investor buyers must factor higher interest rates and financing expenses into their acquisition math.
When reviewing incoming offers, sellers should weigh closing certainty alongside the headline offer price. An investor offering a clean contract with verified proof of funds, a concise inspection timeline, and flexible closing terms often represents a more secure transaction than an offer with a higher nominal price that relies on contingent financing vulnerable to appraisal or underwriting issues. For sellers with substantial equity, offering partial owner financing can help achieve their target price while generating reliable interest income.
What St. Louis Real Estate Investors Should Watch
For investors executing the BRRRR strategy in St. Louis at 6.71% interest rates, priorities must shift from rapid capital recycling to cash-flow sustainability and loan underwriting feasibility. In a four-percent rate environment, pulling out 75% of an asset's value generally left ample cash flow. At today's debt costs, principal and interest payments consume a far greater portion of rental income, often running into Debt Service Coverage Ratio (DSCR) restrictions.
Consider the practical numbers: A standard DSCR program requires a minimum coverage ratio of 1.20 to 1.25, meaning net operating income must exceed monthly debt service (principal, interest, taxes, insurance, and association fees) by 20% to 25%. On a $200,000 takeout loan at 6.71% interest, monthly principal and interest equals approximately $1,292. When factoring in St. Louis real estate taxes and hazard insurance escrows, the total payment frequently reaches $1,550. If market rent for the home is $1,600, the resulting DSCR is roughly 1.03—well below lender minimums. In response, the lender will reduce the allowable loan amount, forcing the investor to leave unexpected equity in the deal.
To navigate this constraint, experienced St. Louis investors are implementing several adjustments:
-
Underwriting acquisitions assuming a 65% to 70% loan-to-value takeout rather than traditional 75% thresholds.
-
Focusing on properties that allow for additional rental revenue, such as two-family properties, finished basement spaces, or detached utility configurations.
-
Partnering with regional St. Louis portfolio lenders—such as Enterprise Bank & Trust, Midwest BankCentre, or local community credit unions—that retain loans on their balance sheets and evaluate total borrower strength rather than rigid automated metrics.
-
Utilizing private capital or negotiating short-term seller carry-backs with 3- to 5-year maturities to maintain operational breathing room until debt markets improve.
ST. LOUIS MARKET SNAPSHOT
| Market Indicator | August 2025 Baseline | August 2026 Latest Data | Year-Over-Year Change | Key Implications for St. Louis Real Estate |
|---|---|---|---|---|
|
Active Listings (Metro) |
5,078 units |
5,850 units |
+15.2% |
Broader property selection for buyers; more competition for sellers. |
|
Median Home Value (Metro) |
$274,340 |
$277,084 |
+1.0% YoY (-0.1% MoM) |
Flat home appreciation requires forcing equity through renovation. |
|
Average Days on Market (Metro) |
22 days |
26 days |
+4 days (+18.2%) |
Market pace is normalizing; holding cost budgets must be expanded. |
|
Listings with Price Cuts |
16.8% of active listings |
17.9% of active listings |
+1.1 percentage points |
Sellers are adapting to current demand; room for purchase negotiations. |
|
30-Year Fixed Mortgage Rate |
6.35% (Early Sep 2025) |
6.71% (Sep 3, 2026) |
+36 basis points |
Higher borrowing costs constrain DSCR limits during takeout refinancing. |
|
Single-Family Rent Index |
$1,389 / month |
$1,443 / month |
+3.9% |
Single-family rental stability supports long-term portfolio performance. |
Table 1 outlines primary market metrics across the St. Louis metropolitan area entering September 2026. The data reflects a normalizing regional market where available inventory has grown by 15.2% while overall home value appreciation has slowed to a 1.0% annual pace. For BRRRR operators, the critical dynamic is the balance between rising inventory and elevated borrowing costs.
With mortgage rates at 6.71% and price reductions representing 17.9% of listings, investors possess greater bargaining power during acquisition. However, because broader market appreciation is flat month-over-month (-0.1%), equity growth must come entirely from effective physical renovations, functional layout improvements, and strong rental property management.
What Just Happened in St. Louis
During late August and early September 2026, several meaningful economic and real estate data releases clarified the state of the local housing market. On September 4, 2026, Freddie Mac published its mortgage survey confirming that benchmark 30-year fixed rates rose to 6.71%, reaching their highest level since July 2025 and dampening consumer purchasing power across the metropolitan area.
Concurrently, MARIS August 2026 market figures released at month-end confirmed that residential supply continued to accumulate in St. Louis County and St. Charles County, lifting regional supply past 2.2 months across the combined territory. In addition, Zillow's August Real Estate Report, released September 8, 2026, showed that national home values cooled slightly, with the St. Louis metro median value edging down 0.1% month-over-month to $277,084.
In rental housing, CoStar reported on September 3, 2026, that urban apartment rent growth flattened across the region, while single-family detached rentals maintained steady demand with a 3.9% year-over-year rent increase. These reports confirm that while transaction velocity is normalizing, demand for quality single-family rental homes in established St. Louis neighborhoods remains dependable.
What Could Be Released Next
During the remainder of the September 8–12, 2026 tracking period, real estate professionals should watch for several scheduled and expected data updates:
-
Freddie Mac Mortgage Rate Survey (Scheduled Thursday, September 10, 2026): This weekly release will show whether the 30-year fixed rate continues its climb beyond 6.71% or levels off, directly influencing borrowing costs for conventional and DSCR loans.
-
MARIS / St. Louis REALTORS® August Comprehensive Housing Report (Expected Mid-September 2026): Following late-August preliminary numbers, this report will provide finalized median sale prices, closed unit counts, and pending contract totals across St. Louis City and County submarkets.
-
Federal Reserve Bank of St. Louis (FRED) Economic Releases (Confirmed Weekly Updates): Regional banking and credit availability data published by the St. Louis Fed will offer insight into liquidity conditions among regional commercial and portfolio lenders.
-
Missouri Department of Labor Employment Updates (Expected Mid-September 2026): Regional employment updates will outline metropolitan job trends, offering visibility into household formation and local tenant stability.
What to Watch During September 2026
Throughout September 2026, active buyers, sellers, and BRRRR investors in the St. Louis market should track three specific local indicators:
First, monitor inventory levels and contract absorption across individual submarkets. If active listings continue to build beyond the 5,850 mark reported in August, buyers will gain additional negotiating leverage, particularly on properties needing repair. Watch the share of listings with price cuts; an increase beyond 18.5% will place further pressure on sellers of outdated homes to adjust their terms.
Second, track the performance spread between single-family and multifamily rental absorption. With single-family detached rents growing at 3.9% annually compared to 1.6% for apartments, BRRRR equity remains safer in single-family neighborhoods throughout South County, St. Charles, and strong urban areas like Tower Grove South. Keep an eye on rental days on market: marketing times exceeding 30 days point to local tenant saturation requiring larger vacancy reserves.
Third, maintain regular communication with local community banks and portfolio lenders across the St. Louis area. As lending guidelines adapt to higher benchmark rates, DSCR thresholds, seasoning rules, and appraisal requirements will shift. Staying in close contact with multiple lenders ensures you can select the most suitable takeout structure when your renovation is ready to refinance.
Key Takeaways and Conclusion
Executing the BRRRR strategy across the St. Louis metropolitan area in September 2026 requires moving away from low-rate habits and applying disciplined, data-driven underwriting. The current market is neither a housing boom nor a distressed downturn; it is an adjusting, bifurcated market shaped by 6.71% borrowing costs, expanded inventory, and discerning buyers.
For active real estate investors, navigating this environment requires five practical adjustments:
-
Underwrite for Cash Flow First: Prioritize durable monthly cash flow over maximum capital extraction. Structure projects around a 65% to 70% refinance loan-to-value rather than 75% to prevent debt payments from violating lender DSCR requirements.
-
Rely Exclusively on Recent Local Comps: Base post-repair values strictly on verified closed sales from the past 60 to 90 days within the immediate neighborhood or municipal border.
-
Capitalize on Distressed Market Timelines: With fixer-uppers averaging 44 days on market, take advantage of slower velocity to negotiate lower purchase prices and obtain repair concessions.
-
Target Resilient Rental Pockets: Focus acquisitions in submarkets with steady single-family rent growth and low vacancy, such as Affton, Crestwood, and proven urban pockets like Tower Grove South.
-
Build Strong Banking Partnerships: Cultivate relationships with St. Louis commercial portfolio lenders and community credit unions that offer flexible terms, interest-rate buydown programs, and local balance-sheet underwriting.
By grounding your investment criteria in current St. Louis market data, budgeting conservatively for rehab expenses, and structuring realistic takeout financing, you can navigate today's interest rate environment and build a profitable, sustainable rental portfolio.
Ready to Buy or Sell in St. Louis? House Sold Easy Has You Covered!
Whether you're thinking about listing your home or exploring a cash offer, it's worth understanding all of your options before making a decision. The right choice depends on your timeline, your property's condition, and your goals. Contact House Sold Easy to discuss your situation and see what makes the most sense for you.Our St. Louis experts know every corner of this city and will make buying your dream home or selling your high-end property a breeze. Don’t miss out on the hottest market in the U.S.! Contact House Sold Easy today and let’s make your real estate goals happen!