Investors Win in Two Tracks as STL Inventory Rises in 2026
Sep 15, 2026
Written by David Dodge
If you've been watching the St. Louis MLS lately, you've probably noticed something that hasn't happened in a few years: there are simply more houses to choose from. Inventory across the metro has been climbing steadily since late winter, and by the time the region rolled into September, that growth had become the defining story of the local market. But before anyone gets too excited about a "buyer's market," it's worth slowing down and looking at what's actually happening underneath the headline number — because rising inventory in St. Louis is not translating into cheaper houses across the board. It's creating something more specific and, frankly, more useful if you know how to read it.
What's Actually Happening in the St. Louis Market Right Now
The topline figures are hard to ignore. Active residential listings across the St. Louis metropolitan area climbed 15.2% year over year, reaching roughly 5,850 units by late August 2026 — the sharpest late-summer supply jump the region has seen in years, according to the St. Louis REALTORS® and Mid-America Regional Information System (MARIS) monthly report. Narrow that down to just the City and County combined, and the trajectory looks similar: MARIS reported City and County inventory at 2,689 homes in February, climbing to 3,171 by May, and by midsummer it had pushed past 3,500. That's not a blip. That's a market steadily loosening up after several unusually tight years.
At the same time, prices haven't budged the way a lot of people would assume. St. Louis County's median single-family closed price reached $320,000 in July, up 8.47% from a year earlier, and metro-wide, Zillow's August 2026 report put the typical St. Louis home value at $277,084, still up 3.3% year over year even though it eased slightly month over month. So here's the contradiction on the surface: inventory is up more than 15%, yet prices in most submarkets kept climbing. That only makes sense once you accept that St. Louis isn't behaving like one market. It's behaving like two.
The Two-Track Market, Explained
Track one is turnkey. In places like Kirkwood, Webster Groves, Clayton, and Ladue, move-in-ready homes are still selling in a median of 12 to 14 days, and buyers with strong credit or dual incomes are still occasionally landing in multiple-offer situations. Nothing about that end of the market feels soft.
Track two is everything else — older housing stock, deferred maintenance, homes priced with more optimism than the comps support. These are the listings that are quietly piling up. Regional months of supply expanded from the tight 1.2-to-1.8-month range typical of 2021 through 2023 out to roughly 2.9 months by August, and within that, price-reduced listings are becoming common rather than rare. By late August, 17.9% of active MARIS listings had logged at least one price cut, up 1.1 percentage points from the same point in 2025. In neighborhoods carrying the most deferred-maintenance inventory — North County pockets like Florissant and Hazelwood, and South City areas like Dutchtown and Gravois Park — price reductions were running noticeably higher than the metro average.
The mortgage rate environment is the mechanism behind all of it. Freddie Mac's Primary Mortgage Market Survey put the 30-year fixed rate at 6.71% for the week ending September 3, 2026, up from 6.05% back in February. That's not a dramatic swing, but it's enough to price a meaningful share of retail buyers out of fixer-uppers. When a $250,000 purchase now costs roughly $240 more a month than it did at the start of the year, buyers with less cash cushion stop bidding on houses that need a new roof or updated wiring. They shift toward homes they can move into without writing a second check. That single behavioral shift is what's separating the two tracks.
Why Rising Inventory Doesn't Mean Falling Prices
This is the part investors newer to the St. Louis market tend to misread. More listings on the MLS does not automatically mean better pricing across the board — it means leverage has shifted, but only in specific places. When inventory climbs off a genuinely low base, as it has here since the tight conditions of 2021 through 2024, the early wave of new listings mostly just normalizes supply. Well-maintained homes in strong school districts still get bid on, because the buyers competing for them haven't gone anywhere. What's changed is the fate of everything sitting in track two.
Those properties carry real costs while they sit: mortgage payments, property taxes, insurance, utilities, and — depending on the neighborhood — municipal occupancy inspections before a new owner can even move in. Every additional week on the market erodes a seller's position a little more. Multiple price cuts signal that a seller has already mentally moved off their original number. Failed contracts, often from financing or inspection issues, put a property back on the market carrying a visible history that makes buyers negotiate harder the second time around. None of this shows up as a metro-wide price decline in the closed-sales data, because it's happening asset by asset, not market-wide. That's exactly why the opportunity is real for investors willing to do the underwriting — and largely invisible to anyone just watching the median price headline.
The Numbers, By Submarket
Averaging the whole metro together hides more than it reveals. Eastern Missouri is a patchwork of independent municipalities, school districts, and tax jurisdictions, and each one is behaving differently right now. The table below breaks out the primary jurisdictions using the most recent August 2026 MLS figures compiled from MARIS and St. Louis REALTORS® data.
| Market Indicator | St. Louis City | St. Louis County | St. Charles County | Metro Area |
|---|---|---|---|---|
| Median Single-Family Closed Price | $225,000 | $320,000 | $365,000 | $277,084 |
| Year-Over-Year Price Change | +2.1% | +8.47% | +4.2% | +3.3% |
| Average Days on Market | 38 days | 23 days | 18 days | 26 days |
| Active Listing Volume | 1,420 | 2,890 | 1,120 | 5,850 |
| Active Inventory Change (YoY) | +16.8% | +15.2% | +9.8% | +15.2% |
| Months of Supply | 3.6 | 3.16 | 2.1 | 2.8 |
| Share of Listings with Price Cuts | 22.8% | 17.2% | 12.4% | 17.9% |
| Median Single-Family Asking Rent | $1,385 | $1,550 | $1,720 | $1,443 |
Table: St. Louis regional real estate snapshot, late summer 2026. Compiled from MARIS and St. Louis REALTORS® August 2026 market data and Zillow's August 2026 rental figures .
A few things jump out once the numbers are side by side. The City carries nearly twice the price-cut share of St. Charles County — 22.8% versus 12.4% — and more than double the months of supply, which is exactly the kind of gap that tells you where seller motivation is concentrated. Meanwhile, rent-to-price math actually favors the City for cash-flow investors: a $1,385 median rent against a $225,000 median price works out to roughly a 0.61% rent-to-price ratio, compared to about 0.47% in St. Charles County, where homes are newer but pricier. Some individual South and North City rental pockets run even higher than that. If your goal is monthly cash flow rather than appreciation, that's a meaningful data point, not a footnote.
How Inventory Actually Climbed This Year
It helps to see the trend rather than just the endpoint. City and County combined active listings went from roughly 2,689 in February to 3,171 by May, then past 3,500 by midsummer — a steady, unbroken climb rather than a single-month spike. The chart below shows that build-out.
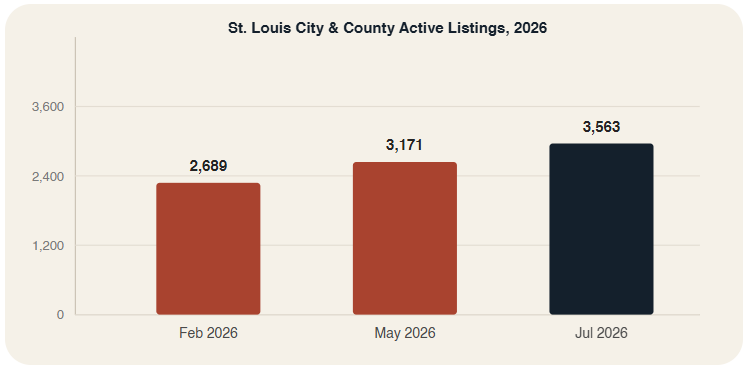
Graph: Combined St. Louis City and County active residential listings by month, 2026. Source: MARIS / St. Louis REALTORS® monthly housing reports.
What that shape tells you is that this is organic accumulation, not a sudden dump of new construction. Homes are simply taking longer to sell than they did a year or two ago, so listings that would have gone under contract in three weeks are now still sitting at week six or eight, stacking up month over month. That's a slower-absorption story, not an oversupply story — and it matters because it means the leverage shift is gradual and durable rather than a one-time event that will correct itself by October.
Geography Matters More Than the Metro Average
Treating "St. Louis" as one market is probably the single most common mistake investors make here. The region is made up of dozens of independent municipalities with their own tax rates, inspection requirements, and housing stock, and deal-hunting strategy needs to change block by block, not just county by county.
St. Louis City. This is where days-on-market and price-cut share are running highest — an average of 38 days with a median value of $225,000. South City corridors — Tower Grove South, Dutchtown, Gravois Park, Benton Park West — are where a lot of unrenovated brick flats and single-family homes are sitting past the five-week mark. Tower Grove South itself is something of an exception; two-to-four-family brick buildings there regularly clear $350,000 on the strength of rental demand from hospital and university staff nearby. North City requires a different sourcing approach entirely — tax liens, probate filings, and code violations tend to surface better opportunities than straight MLS searches.
St. Louis County. The county is really 88 municipalities wearing one trench coat. Kirkwood, Webster Groves, and Ladue keep moving fast because school-district demand hasn't cooled. North County — Florissant, Hazelwood, Jennings — is where supply has piled up the most; countywide supply reached 3.16 months, more than double the roughly 1.5-month levels seen at the last market peak, and homes needing mechanical or cosmetic work there routinely need multiple price cuts. South County — Affton, Mehlville, Lemay — offers a middle ground: affordable mid-century brick ranches with straightforward, non-specialized repair scopes.
St. Charles County. This remains the tightest submarket in the region, with 18-day average marketing time and just 2.1 months of supply. Sourcing deals here isn't about finding stale listings — there aren't many. It's about timing: new-construction closing dates create move-up sellers who need to close on a specific calendar, and that timing pressure is where the leverage lives.
Jefferson and Franklin Counties. Further out, lower property taxes and looser zoning in places like Arnold, Imperial, and Festus attract commuters looking for bigger lots or small multi-family setups, while Franklin County's small-town markets around Washington, Union, and Pacific stay steady on the back of local manufacturing employment. Properties here take a bit longer to move when rates rise, which can work in a patient buyer's favor.
How to Actually Score a Deal Right Now
Not every listing that's been sitting for a month is a real opportunity — plenty are just overpriced and will eventually sell close to ask once the seller adjusts. The properties worth chasing tend to share a specific combination of traits, and it's worth running every lead through the same checklist before you spend time on outreach:
- Days on market above the local norm — 30-plus in the City, 25-plus in the County, adjusted for the submarket's typical pace.
- Two or more price reductions totaling at least 8–10% off the original list — this is the clearest signal a seller has already recalibrated their expectations downward.
- Visible deferred maintenance — an outdated roof, old mechanicals, or a kitchen that hasn't been touched since the 1990s. Retail buyers financing at 6.7%-plus increasingly won't take on that repair bill themselves.
- A motivated-seller situation — an expired listing, an estate sale, a landlord who's tired of managing tenants, or a pre-foreclosure filing. Life circumstances create urgency that price alone doesn't.
- Real equity position — a seller who owns free and clear or has substantial equity from a long hold can actually afford to discount for speed and certainty; one who's underwater usually can't.
- A workable exit at current financing costs — run the numbers at 6.71%-plus and make sure a wholesale, flip, or BRRRR exit still pencils before you get attached to the deal.
A property that checks most or all of these boxes is worth an aggressive, well-prepared outreach effort. One that only hits one or two is probably still priced for a retail buyer, and chasing it will just waste time.
What This Means Depending on Where You're Starting From
If you're newer to investing here, rising inventory is actually a gift — it gives you room to practice without the pressure of a bidding war forcing a decision in 48 hours. Build a watchlist of 20 to 30 properties in one or two target submarkets, and actually track them: days on market, price changes, agent remarks. You'll start to develop an instinct for the difference between a genuinely motivated seller and one who's just testing the water at an ambitious number. Resist the urge to spread across five neighborhoods at once — depth in one or two areas, where you actually know the comps, the typical repair costs, and the local inspection requirements, beats breadth every time.
If you've already got deal flow, this is the moment to get systematic rather than opportunistic. That means segmenting your CRM and building consistent follow-up campaigns around specific categories: listings with two-plus price cuts sitting past 30 days, expired or withdrawn listings from the past 60 to 90 days, multi-family properties past 60 days in rental corridors, and estate or probate leads where heirs don't have the capital or appetite to renovate before selling. The honest truth is that finding these listings isn't the hard part anymore — they're sitting right there on MARIS. The advantage goes to whoever follows up consistently while everyone else chases the next "hot" pocket of the market.
It's also worth building dual underwriting into every deal review rather than defaulting to a flip. St. Louis single-family rents grew 3.9% year over year to a median of $1,443 as of August, and CoStar's multifamily tracking put metro apartment asking rents at $1.51 per square foot, up 1.6% annually — steady, unspectacular growth that's holding up better than a lot of faster-growing Sunbelt metros. If a property pencils at a 1.25x debt service coverage ratio or better as a rental, that's often a safer bet right now than betting on a fast retail resale in a market where homes needing work are averaging 38-plus days.
Running the Numbers on an Actual Deal
Example only — illustrative, not an actual current listing.
Picture a 3-bedroom, 2-bath brick ranch in Florissant, originally listed at $189,900 back in June. By early September, after 60-plus days on the market and two price reductions, it's down to $169,900. It needs roughly $35,000 in work — roof, HVAC, kitchen, bath, and flooring.
- ARV based on nearby comps: $235,000
- Negotiated purchase price: $155,000 (as-is, cash)
- Repairs: $35,000
- Hard money financing (12%, 12 months): approximately $18,600
- Holding costs — taxes, insurance, utilities over 6 months: approximately $6,000
- Selling costs (6% plus closing): approximately $14,100
- All-in total: approximately $228,700
- Potential flip margin: roughly $6,300 — thin, and it only works if repair and financing costs stay disciplined
Run the same property as a hold instead. At a rent near the $1,550 County-area median and a 6.71%-plus refinance, the DSCR math often looks more attractive than the flip margin does — which is exactly the calculation more investors are running by default this fall rather than assuming a quick resale will clear a comfortable profit.
A Practical Week for Getting Started
If you want to put this into motion rather than just read about it, here's a realistic sequence:
- Days 1–2: Pull every active listing in your target submarket with 25-plus days on market and at least one price cut. Log original price, current price, days on market, number of reductions, and agent remarks in a spreadsheet.
- Day 3: Drive the properties. Photograph exterior condition, look for vacancy signs, and eliminate anything that doesn't clear your repair or neighborhood criteria.
- Days 4–5: Start calling listing agents. Ask about the seller's timeline, any feedback from prior showings, whether other offers are pending, and whether the seller would consider an as-is cash offer.
- Day 6: Submit written offers on your three to five strongest leads, structured with flexible closing timelines, as-is or limited-inspection terms, and minimal contingencies.
- Day 7: Follow up on everything. If an offer is rejected, ask directly what price or terms would work, and add that property to a 60-day follow-up list rather than writing it off.
What to Watch Between Now and October
A handful of releases in the next few weeks will shape how the rest of the fall plays out. Freddie Mac's next weekly rate survey lands Thursday, September 17, and whether the 30-year average holds above 6.70% or drifts back toward the mid-6% range will directly affect how many retail buyers stay active in the fixer-upper end of the market. MARIS is also expected to release preliminary September numbers mid-month, which will show whether the late-August inventory surge carries into early fall or whether the usual back-to-school slowdown in new listings kicks in. And St. Louis County's post-Labor Day judicial land tax sale, run through the Sheriff's Department, is worth watching for anyone hunting tax-delinquent parcels in North County or older inner-ring suburbs.
On the rental side, HUD's newly published FY2027 Fair Market Rent schedule raised the St. Louis metro two-bedroom baseline from $1,218 to $1,349, a 10.8% jump that's worth a look for anyone with Section 8 tenants or considering that route on a value-add rental — it's a meaningful bump in guaranteed rental income for landlords in the City and inner-ring County.
The Bottom Line
St. Louis inventory growth is real, and it's the most significant shift the local market has seen in years — but it's not handing out discounts evenly. It's creating leverage through seller fatigue on a specific slice of the market: older homes, deferred maintenance, and listings that have already been marked down once or twice. The investors doing well right now aren't the ones waiting for a broad price correction that isn't coming. They're the ones treating each submarket individually, underwriting at today's borrowing costs rather than 2021's, and following up consistently on the sellers everyone else has already moved past.
Know the data for your specific target neighborhoods. Apply a consistent framework instead of gut instinct. Track your outreach like it's a pipeline, not a hobby. That's genuinely how a repeatable acquisitions business gets built in this market — not by timing some metro-wide dip that the numbers don't support.
Sources: St. Louis REALTORS® & MARIS Monthly Housing Reports; House Sold Easy, "St. Louis Market 2026: 3 Must-Make Investor Adjustments," Sept. 12, 2026House Sold Easy, "How to Find Motivated Sellers in St. Louis (2026 Guide)," Sept. 9, 2026; Freddie Mac Primary Mortgage Market Survey, week ending Sept. 3, 2026; Zillow August 2026 Market Report; CoStar, "Apartment Rents Flatline in August Across St. Louis," Sept. 3, 2026; HUD FY2027 Fair Market Rents schedule, published Sept. 1, 2026
Ready to Buy or Sell in St. Louis? House Sold Easy Has You Covered!
Whether you're thinking about listing your home or exploring a cash offer, it's worth understanding all of your options before making a decision. The right choice depends on your timeline, your property's condition, and your goals. Contact House Sold Easy to discuss your situation and see what makes the most sense for you.Our St. Louis experts know every corner of this city and will make buying your dream home or selling your high-end property a breeze. Don’t miss out on the hottest market in the U.S.! Contact House Sold Easy today and let’s make your real estate goals happen!