St. Louis Housing: Buyer’s or Seller’s Market?
Sep 24, 2026
Written by David Dodge
A plain-English look at the September 2026 numbers and how to figure out which market your house (or your next house) is really in.
Ask ten St. Louis realtors this fall whether we're in a buyer's market or a seller's market, and you'll probably get six different answers and a couple of shrugs.
It's the question that comes up at every open house in Kirkwood, every backyard barbecue in Florissant, and every "hey, quick question" text from a cousin in St. Charles. Should I sell now? Should I wait? Should I make an offer below asking, or will I get laughed out of the room?
The confusing part is that the headlines don't agree with each other. One week you read that home prices in St. Louis County jumped double digits. The next week you read that list prices are falling. Mortgage rates are creeping back toward 7%, yet the metro is on pace to sell more homes this year than last. If you're trying to make a decision about the biggest asset you own, that kind of mixed signal is frustrating.
Here's the thing, though. Both sides of that argument are reading the data correctly. St. Louis isn't one market right now. It's at least two markets sharing the same zip codes, and which one you're in depends a lot on what kind of house you have, what it costs, and where it sits.
So instead of giving you a one-word answer, I want to walk through the actual case for each side using the most recent numbers we have (most of them published this month), explain why the market has split the way it has, and then give you a simple checklist you can use to figure out where your own home stands. No jargon, no hype. Just what the numbers say and what they mean for you.
The seller's market case
Let's start with the argument that sellers still have the upper hand, because there's a lot of real evidence behind it.
Demand hasn't gone anywhere
The first thing to know is that people are still buying homes in St. Louis. Quite a few of them, actually. By the end of August 2026, the metro area had recorded 23,643 home sales for the year, about 4.07% more than the 22,718 sold over the same stretch in 2025. That's not what a stalled market looks like. That's a market where buyers kept showing up even as borrowing costs went the wrong direction.
Prices tell the same story. Across the St. Louis MSA, the median sold price in August 2026 was $305,000, up 6.09% from $287,500 a year earlier. And in St. Louis County specifically, the number was even stronger. Homes in the county sold for a median of $325,000 in August, a 12.11% jump from $289,900 in August 2025.
If you own a home in the county and those numbers sound good, they should. Closed prices, the ones that actually hit the bank at the title company, are still climbing.
The affordability advantage is real
A big reason demand has held up is that St. Louis is still a bargain compared with most of the country. People relocating from the coasts or from the Sunbelt boomtowns tend to do a double-take when they see what a few hundred thousand dollars buys here.
This isn't just local pride talking. Homes.com's market report found that St. Louis ranked 36th in price among the 40 largest U.S. housing markets in March 2026, with a median home price of $285,000, which was 26% below the national median. A few months later, a MoneyLion analysis reported in May named St. Louis the most affordable major housing market in the country, estimating that buyers of a typical new home here would spend about 26.3% of median income on housing costs.
When somebody's coming from Austin, Denver, or the Chicago suburbs, a 7% mortgage on a $300,000 brick ranch in South County still looks like a deal. That relocation traffic puts a floor under demand that a lot of other metros don't have.
Good homes still sell close to asking, and fast
The other piece of the seller's case is how well-priced homes perform. Earlier this year, Houzeo's St. Louis market tracker showed homes selling for about 95.5% of their asking price, with roughly 3.6 months of supply on the market. That's a healthy number. It means the typical seller walks away with most of what they asked for, and the right homes do better than that.
Speed is the other giveaway. In mid-September, the fastest-moving zip code in the metro was Washington, where listings were going under contract in an average of just 4 days. Four days. That's not a market where buyers are sitting back waiting for sellers to cave.
You can also see it in the stories agents are telling. One local agent wrote in late August about a qualified buyer who paused their search for a year because needing closing-cost help from sellers kept making their offers less competitive. Another described buyers in a multiple-offer situation who chose to waive their own inspection to make their offer stand out. Those are classic seller's market behaviors, and they're happening right now, in 2026, in St. Louis.
If your home is updated, priced right, and sitting in a neighborhood people are actively hunting in, you are very likely still in a seller's market.
So far, so good for sellers. But that's only half the picture.
The buyer's market case
Now let's flip it around, because the buyer's side has some numbers that are just as hard to argue with.
Active listing prices dropped hard in St. Louis County
This is the stat that's been bouncing around real estate social media all summer. In July 2026, the median list price for homes in St. Louis County was $250,000, down 13.76% from $289,900 in July 2025. That's the roughly 14% drop you may have heard about.
And the gap didn't close in August. It got wider. The county's median list price in August 2026 came in at $240,000, a 17.24% decline from the $290,000 median list price a year earlier.
Now, I want to be careful here, because this number gets misread a lot. A lower median list price does not mean every house in the county is suddenly worth 14% or 17% less. Remember, the median sold price went up over the same period. What the list-price number really tells you is what's sitting on the market: more lower-priced homes, more homes that need work, and more sellers who started high and had to come down. That mix shift matters, because it means buyers are seeing more options at more price points than they have in years.
Inventory is finally thawing
For most of the last few years, the problem in St. Louis wasn't a lack of buyers. It was a lack of houses. A lot of homeowners locked in mortgages at 3% or less back in 2020 and 2021, and they had zero interest in trading that for something in the 6s or 7s. Economists call it the "rate lock-in effect." Everyone else just called it "there's nothing for sale."
That's loosening. Life happens: people get new jobs, have kids, get divorced, downsize, or inherit a parent's house. Eventually the reasons to move outweigh the reasons to stay. Realtor.com data for June 2026 showed 6,274 active listings across the St. Louis metro, up about 10.2% from a year earlier, with a median of 44 days on market, 10% longer than the year before.
More listings plus more time on market is exactly the combination that gives buyers breathing room. When a house sits for six weeks instead of six days, the conversation between buyer and seller changes.
Fewer sales in the county, and rates are pushing buyers to the edge
Even though metro sales are up for the year, the most recent month tells a different story in some places. St. Louis County recorded 1,173 home sales in August 2026, down 10.80% from 1,315 in August 2025. Across the whole MSA, August sales totaled 3,204, a 2.79% drop from the year before.
Mortgage rates are a big part of why. Freddie Mac's weekly survey put the average 30-year fixed rate at 6.95% as of September 17, 2026, up from 6.76% the week before and 6.26% a year ago. That was the fourth weekly increase in a row, and Reuters described it as roughly a 20-month high. Locally, some lenders are already past that line. St. Louis Real Estate News reported the local 30-year fixed average climbing to 7.24% in mid-September.
What does that do to a real person's budget? On a $300,000 loan, the gap between a 6% and a 7% rate works out to about $200 a month, or roughly $72,000 over the life of the loan. Some buyers absorb that. Others drop down a price bracket, and some step out of the market entirely. Every buyer who steps out is one less competing offer on the house you want.
Sellers are asking for more than buyers will pay
Franklin County is a good example of the tug-of-war. The median sold price there fell 7.00% year over year to $272,500 in August, while the median list price rose 17.12% to $317,400. Read that twice. Sellers are asking more, buyers are paying less. When that happens, price cuts are coming.
The City of St. Louis has its own version of this. In July 2026, city homes sold for a median of $235,000, down 5.51% from $248,700 in July 2025, even though the number of sales rose 16.79%. More deals, lower prices. That's buyers getting their way.
And in our own tracking of the local MLS this summer, about 17.9% of active St. Louis listings had taken at least one price cut by mid-August. Roughly one in five sellers misjudged the market on day one.
If you're buying in the right segment, you can ask for inspection repairs, closing-cost help, and a price below asking again, without getting laughed out of the room.
Here's what that looks like when you put the list prices and sold prices side by side across the region.
What sellers asked vs. what buyers paid, August 2026
Median sold price and median list price by market, in thousands of dollars
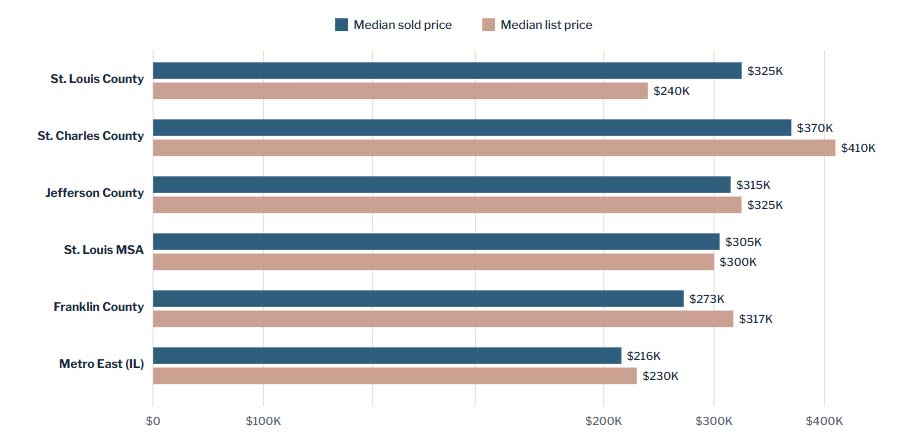
Figures rounded to the nearest thousand. Data from MORE, REALTORS® market updates published by St. Louis Real Estate News for St. Louis County, St. Charles County, Jefferson County, the St. Louis MSA, Franklin County, and the Metro East, September 2026.
Notice how different the gaps are. In St. Louis County, homes sold well above the typical asking price, suggesting the listings that close are the better homes, while a lot of lower-priced inventory sits. In St. Charles and Franklin counties, it's the opposite: sellers are listing above what buyers are ultimately paying—same metro, same month, very different conversations at the closing table.
The real answer: it depends on price point, condition, and neighborhood
So which is it? The honest answer is the one nobody wants to hear at a barbecue: it depends. But it depends on specific, knowable things, and once you understand them the whole "buyer's or seller's" debate starts to make sense.
What "bifurcation" means in plain English
You'll hear real estate people use the word "bifurcation" a lot this year. All it means is that the market has split into two tracks that are behaving differently at the same time.
Think about driving out Highway 94 on a Saturday. One lane is cruising along at the speed limit. The other lane is stuck behind a tractor. Both lanes are on the same road, heading the same direction, but your experience depends entirely on which lane you're in. That's the St. Louis housing market in September 2026.
In the fast lane, move-in-ready homes in high-demand areas and strong school districts are often going under contract within 4 to 7 days, while dated homes, homes with big deferred-maintenance items, or listings with wishful price tags are sitting 44 days or longer and usually need a price cut or seller concessions to get sold.
Which lane a home ends up in comes down to three things.
1. Price point
With rates near 7%, every dollar of purchase price hurts a little more than it did two years ago. That squeezes different buyers in different ways.
At the entry level, lots of buyers are stretching to qualify, often with FHA or VA loans and small down payments. They're very sensitive to monthly payment, so they compete hard for the few affordable homes that don't need work, and they pass on anything that would require a big check after closing.
At the higher end, buyers usually have more cash and more options, so they can afford to be picky. That's where you see sellers overshooting. In St. Charles County, the August median list price was $409,900, up 10.26% from a year ago, while the median sold price was $370,000, a gap of roughly $40,000 between what sellers hoped for and what buyers paid.
In the middle, things look more balanced. Jefferson County homes sold for a median of $315,000 in August, up 5.00% from a year earlier, with a median list price of $324,900. Asking and selling prices are close together, which usually means sellers are pricing realistically and buyers are meeting them.
2. Condition
This is the biggest dividing line of all, and it makes total sense once you think about it from the buyer's side.
If you're paying close to 7% on your mortgage, your monthly payment is already stretching your budget. You probably put most of your savings into the down payment and closing costs. So when you walk into a house with a 22-year-old roof, original windows, and a furnace that sounds like a dump truck, you're not thinking "fixer-upper opportunity." You're thinking, "where would I even get the money for that?"
That's why St. Louis's older housing stock is feeling this split so sharply. A lot of our homes are 60, 80, even 100-plus years old. The ones that have been updated sell like it's 2022. The ones that haven't are fighting for a much smaller pool of buyers, mostly investors and cash buyers who price in every repair.
3. Neighborhood
Finally, location still matters as much as it ever has. Some pockets of the metro are so in-demand that the broader slowdown barely touches them. We already mentioned Washington averaging 4-day sales. Parts of the county with top school districts behave the same way.
Other areas, particularly ones with more older inventory and more listings coming on, are clearly softer. Across the river in the Metro East, the August median sold price was $216,000, up 5.37% from a year earlier, but down 8.09% from July's $235,000. That kind of month-to-month swing tells you buyers are paying close attention to price.
Here's a snapshot of how the main St. Louis area markets looked in the most recent monthly reports.
St. Louis Area Market Snapshot: Most recent monthly data available as of September 2026
|
Market |
Month |
Median Sold Price |
Sold Price vs. Last Year |
Home Sales vs. Last Year |
Which Way It Leans |
|---|---|---|---|---|---|
|
St. Louis MSA |
Aug 2026 |
$305,000 |
+6.09% |
−2.79% |
Balanced, slightly seller-leaning |
|
St. Louis County |
Aug 2026 |
$325,000 |
+12.11% |
−10.80% |
Split: strong for top homes, soft for the rest |
|
St. Charles County |
Aug 2026 |
$370,000 |
+2.78% |
+7.57% |
Active, but sellers are overpricing |
|
Jefferson County |
Aug 2026 |
$315,000 |
+5.00% |
Up |
Seller-leaning |
|
Franklin County |
Aug 2026 |
$272,500 |
−7.00% |
−11.29% |
Buyer-leaning |
|
Metro East (IL) |
Aug 2026 |
$216,000 |
+5.37% |
+2.04% |
Balanced, price-sensitive |
|
City of St. Louis |
Jul 2026 |
$235,000 |
−5.51% |
+16.79% |
Buyer-leaning |
Sources: St. Louis Real Estate News monthly market updates using MORE, REALTORS® data, published August 31 to September 20, 2026 (MSA, St. Louis County, St. Charles, Jefferson, Franklin, Metro East, City of St. Louis). The "which way it leans" column is our read of the numbers, not part of the source data. Jefferson County's report noted sales rose in August, but the percentage wasn't included in the summary.
Look at that table for a minute, and you'll see why the "buyer's or seller's" question is so hard to answer in one word. The county and the city are moving in opposite directions on price. St. Charles is busy but overpriced. Franklin County is cooling. All in the same metro, all in the same month.
The question isn't really "What kind of market is St. Louis in?" It's "What kind of market is my house in?"
How to tell which market you're in
Good news: you don't need an economics degree or an expensive data subscription to figure out which lane your home is in. You need a handful of numbers that any good local agent can pull in about fifteen minutes, and a lot of them you can eyeball yourself on the big listing sites.
Here's the checklist I'd use. Run through it for your specific neighborhood and your specific kind of home, not for "St. Louis" in general.
A quick way to score it: Give yourself a point for every item that points toward sellers (fast days on market, few price cuts, under three months of supply, sales at or above 98% of asking, updated home). If you land at four or five points, you're in a seller's market and should price with confidence. At two or three, you're balanced, so price carefully and expect some back-and-forth. At zero or one, buyers have the leverage, and you'll need either a sharp price, some repairs, or a different way to sell.
One more tip for buyers: if you're shopping in a neighborhood that scores low on this checklist, don't be shy about asking for closing-cost help, repair credits, or a longer inspection window. Those requests would have gotten you nowhere in 2022. In a lot of St. Louis neighborhoods right now, they're just part of the conversation.
And for sellers: the biggest mistake I see this year is pricing based on what a neighbor got in 2024 or on the headline that county prices are up 12%. That 12% is being driven by the best homes in the best spots. If your home is in the other lane, pricing like it's in the fast lane is the quickest way to end up as one of those listings with two price cuts and 60 days on market.
So, where does that leave you?
If you only take one thing from all of this, let it be this: St. Louis isn't a buyer's market or a seller's market in September 2026. It's both, depending on the house.
Closed prices are rising in much of the metro; the region is still one of the most affordable big housing markets in the country, and the best homes are selling in days. At the same time, rates near 7% are squeezing budgets, inventory has grown, list prices in the county have fallen sharply, and a meaningful share of sellers are cutting prices to get deals done.
Both of those stories are true. Your job, whether you're buying or selling, is to figure out which one applies to you. The checklist above will get you most of the way there.
Not sure which lane your house is in? Let's figure it out together.
At House Sold Easy, we work with St. Louis homeowners every day who are trying to answer this exact question. Some have homes that are perfect for the open market, and we'll tell you that straight. Others have homes that need work, have been sitting longer than they expected, or just need a simpler, faster path to closing.
Our House Sold Easy service is built for that second group. We'll look at your home, walk you through what the local numbers actually say about your neighborhood and your price point, and give you a clear, no-pressure option to sell without the guesswork. If the traditional route is the better fit for you, we'll say so.
Either way, you'll walk away knowing exactly which market you're in and what your real options are.
Ready to Buy or Sell in St. Louis? House Sold Easy Has You Covered!
Whether you're thinking about listing your home or exploring a cash offer, it's worth understanding all of your options before making a decision. The right choice depends on your timeline, your property's condition, and your goals. Contact House Sold Easy to discuss your situation and see what makes the most sense for you.Our St. Louis experts know every corner of this city and will make buying your dream home or selling your high-end property a breeze. Don’t miss out on the hottest market in the U.S.! Contact House Sold Easy today and let’s make your real estate goals happen!