Why Your St. Louis House Isn't Selling (And What to Do)
Sep 02, 2026
Written by House Sold Easy Team
"My St. Louis house has been listed on the market for over thirty days, and I haven't received a single serious, qualified offer."
If that scenario describes your current listing experience, you are far from alone. Navigating the Greater St. Louis real estate market during late summer and early autumn 2026 presents an entirely different set of operational challenges than homeowners encountered only two or three years ago. For a prolonged stretch of time, property owners enjoyed unprecedented pricing power, record-low borrowing costs, and severe inventory shortages that routinely masked pricing errors and cosmetic flaws. Sellers could list properties with aging mechanical systems, dated finishes, or aspirational price tags and still anticipate multiple competitive bids within forty-eight hours of hitting the regional Multiple Listing Service.
That dynamic has changed in fundamental ways. According to recent regional housing data released by housesoldeasy.com, approximately 17.9% of active residential listings across the Greater St. Louis metropolitan area carried at least one price reduction by mid-August 2026. That represents an increase of roughly 1.1 percentage points compared to the same timeframe in 2025. Furthermore, market analytics compiled by MORE, REALTORS® reveal a stark divergence in St. Louis County: the median list price for active inventory dropped 13.76% year-over-year to $250,000, while closed transactions across the same geographic baseline achieved a median sold price of $320,000—an 8.47% increase.
That statistical gap between what the broader inventory is asking and what qualified buyers are actually willing to pay at the closing table reveals the defining trend of 2026: market bifurcation. The local market has not suffered a sudden crash, nor is it experiencing a speculative boom. Instead, it has fractured into a high-velocity tier of pristine, realistically priced homes and a stagnant tier of properties burdened by deferred maintenance, unaddressed municipal inspection hurdles, or miscalculated valuations. If your home has stalled on the market, diagnosing the root cause—and executing a data-driven adjustment—is the only reliable path to securing a contract.
Current St. Louis Market Context: The Shift Away from Extreme Scarcity
To understand why a specific property fails to generate showings or written offers, you must first examine the broader regional environment shaping buyer psychology across the St. Louis metropolitan area.
For nearly half a decade, the overarching theme of St. Louis real estate was severe housing scarcity. Buyers possessed minimal negotiating leverage, routinely waived home inspection contingencies, and absorbed structural repair expenses out of pocket simply to secure residential property.
However, housing metrics released by Dawn Griffin Group / St. Louis REALTORS® show that active single-family listings across St. Louis City and St. Louis County expanded to 3,563 units—a 15.2% year-over-year inventory increase. Concurrently, available housing supply across St. Louis County climbed to 3.16 months of inventory, representing a significant upward movement from the 1.2 to 1.5 months recorded during peak seller squeezes.
A supply level of 3.16 months places St. Louis County in an active transition zone. While classic real estate economics defines a true "buyer's market" as requiring six or more months of inventory, a jump to 3.16 months dramatically alters day-to-day transaction dynamics.
With mortgage borrowing rates fluctuating throughout 2026, monthly debt service costs consume a far greater share of a buyer's net income than during the era of sub-4% loans. When capital is expensive, prospective purchasers become intensely analytical. They calculate the long-term carrying cost of each property and refuse to pay premium valuations for houses that require immediate out-of-pocket capital improvements.
Consequently, St. Louis buyers are exercising newfound selectivity. They visit open houses with a critical eye, comparing roof ages, electrical panels, foundation conditions, and floor plan functional utility. If a listing fails to demonstrate compelling value relative to active alternatives, buyers simply walk away and wait for newer listings to hit the market.
The Real Reasons St. Louis Homes Are Sitting Unsold
When a listing lingers on the market past the three-week threshold, sellers often blame poor agent marketing, seasonal weather, or economic uncertainty. While presentation and market timing play roles, properties fail to sell primarily due to identifiable misalignments between seller expectations and real-time buyer demand.
1. Overpricing Relative to True Closed Comparable Sales
Overpricing remains the most common obstacle to a successful closing. Sellers frequently fall into cognitive traps when setting their initial asking price:
-
Anchoring to Peak Historical Comps: Expecting 2023 or early 2024 peak valuations without accounting for the 15.2% expansion in competitive inventory.
-
Confusing List Price with Sold Price: Looking at active neighborhood listings that are themselves overpriced and using those unverified asking prices as validation.
-
Over-Reliance on Automated Portal Valuations: Relying on computer algorithms that cannot evaluate internal wear, structural settling, or functional layout deficiencies.
As demonstrated by the drop in St. Louis County median list prices to $250,000 alongside an increase in median sold prices to $320,000, active inventory contains an expanding pool of discounted or lower-grade properties struggling for attention. Meanwhile, closed transactions reflect well-prepared, realistically priced homes. When an asking price exceeds justifiable market value by even 5%, automated MLS search filters hide the home from its ideal buyer demographic.
2. Condition Deficits and the "Turnkey Premium"
In the current economic climate, local contractor rates and building material costs remain elevated. Consequently, St. Louis buyers place an enormous premium on move-in-ready, turnkey properties.
Major structural updates—such as replacing an architectural roof, replacing galvanized plumbing, updating an obsolete 100-amp electrical box, or repairing basement foundation wall movement—cost thousands of dollars in upfront cash. When a home requiring $35,000 in necessary repairs is listed at a turnkey price minus a token $5,000 discount, buyers do not see a minor project; they see financial risk and disruption. They will consistently bypass the fixer-upper in favor of a modernized alternative.
3. The "Two-Track" Velocity Pattern
The Greater St. Louis market has fractured into two distinct velocity tracks:
-
Track 1 (Hyper-Fast / Competitive): Updated, move-in-ready single-family residences priced under $450,000 in premier municipalities and school districts (such as Kirkwood, Webster Groves, Clayton, Parkway, and Lindbergh) routinely go under contract within 4 to 7 days, often triggering competitive bidding situations.
-
Track 2 (Stagnant / Price Cut Heavy): Properties that require substantial modernization, feature unaddressed mechanical issues, or are priced at the top of their neighborhood value range sit for 44 days or more. These listings experience steep declines in showing volume and require repeated price adjustments to regain traction.
4. Late Summer Seasonal Transitions
Listing a home in late August or early September introduces specific calendar headwinds. As families settle into the academic school year across districts like Rockwood, Parkway, Ladue, and Francis Howell, casual summer foot traffic dissipates.
The buyer pool shifts toward corporate relocations, downsizers, first-time purchasers, and real estate investors. A listing that entered the market in early July without price or condition adjustments faces severe competition from fresh autumn inventory entering the MLS.
Latest Market Data and Analysis
To evaluate how these structural shifts impact local real estate decisions, we examine the primary market indicators defining the St. Louis landscape.
PRIMARY MARKET TREND: ST. LOUIS INVENTORY & PRICING DYNAMICS
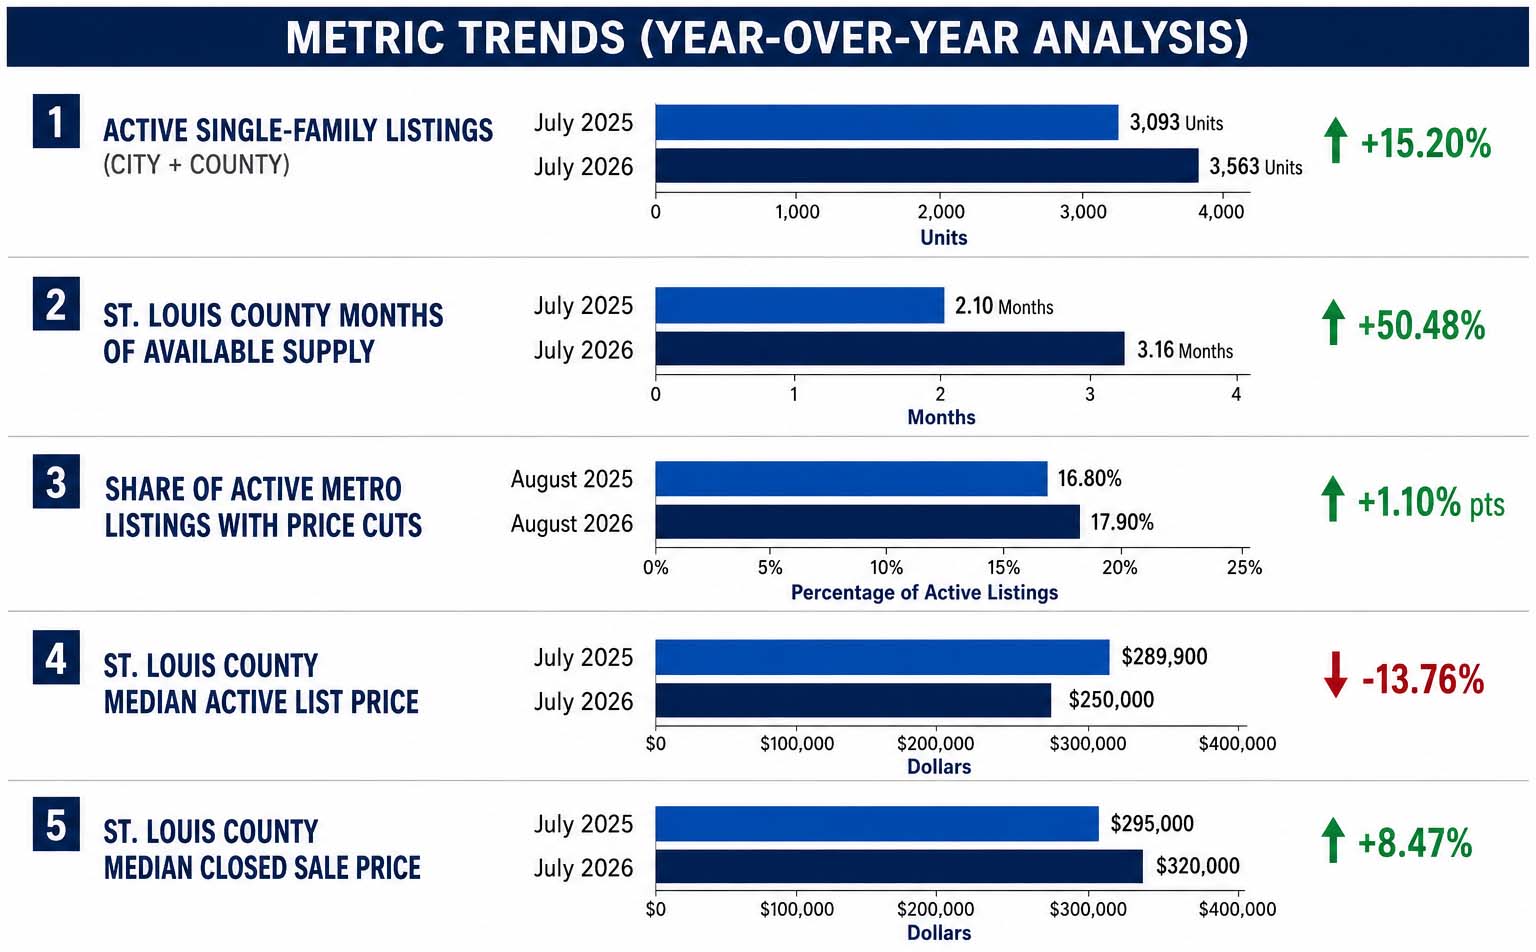
Data Source: MARIS / St. Louis REALTORS® / MORE, REALTORS® (July 2026 Data Released August 2026) Geographic Scope: St. Louis City & St. Louis County Combined / St. Louis County Baseline
Analysis of Graph 1: The Pricing and Supply Divergence
Graph 1 illustrates the operational challenges confronting sellers across Greater St. Louis. The data highlights a pronounced divergence: while active single-family inventory expanded by 15.20% year-over-year (reaching 3,563 units) and months of supply grew by more than 50% to 3.16 months, pricing trajectories moved in opposing directions.
Closed sale prices demonstrated continued resilience, climbing 8.47% to a median of $320,000 in St. Louis County. This confirms that solid equity gains remain attainable for high-quality properties.
However, median active list prices fell by 13.76% to $250,000, and the share of properties forced into price reductions climbed to 17.90%. This reveals that active inventory contains a growing accumulation of lower-tier, distressed, or mispriced listings that cannot sell at their initial asking prices. Sellers who fail to align their list price with verified recent comps quickly find themselves sitting in the stagnant inventory pool, where price cuts become unavoidable.
Local St. Louis Market Differences: Submarket Breakdown
The Greater St. Louis real estate market is far from homogeneous. Broad metro averages often conceal massive variations in pricing power, buyer demand, and days on market between distinct submarkets and municipal boundaries.
SECONDARY MARKET COMPARISON: MEDIAN SALE PRICE & VELOCITY BY SUBMARKET
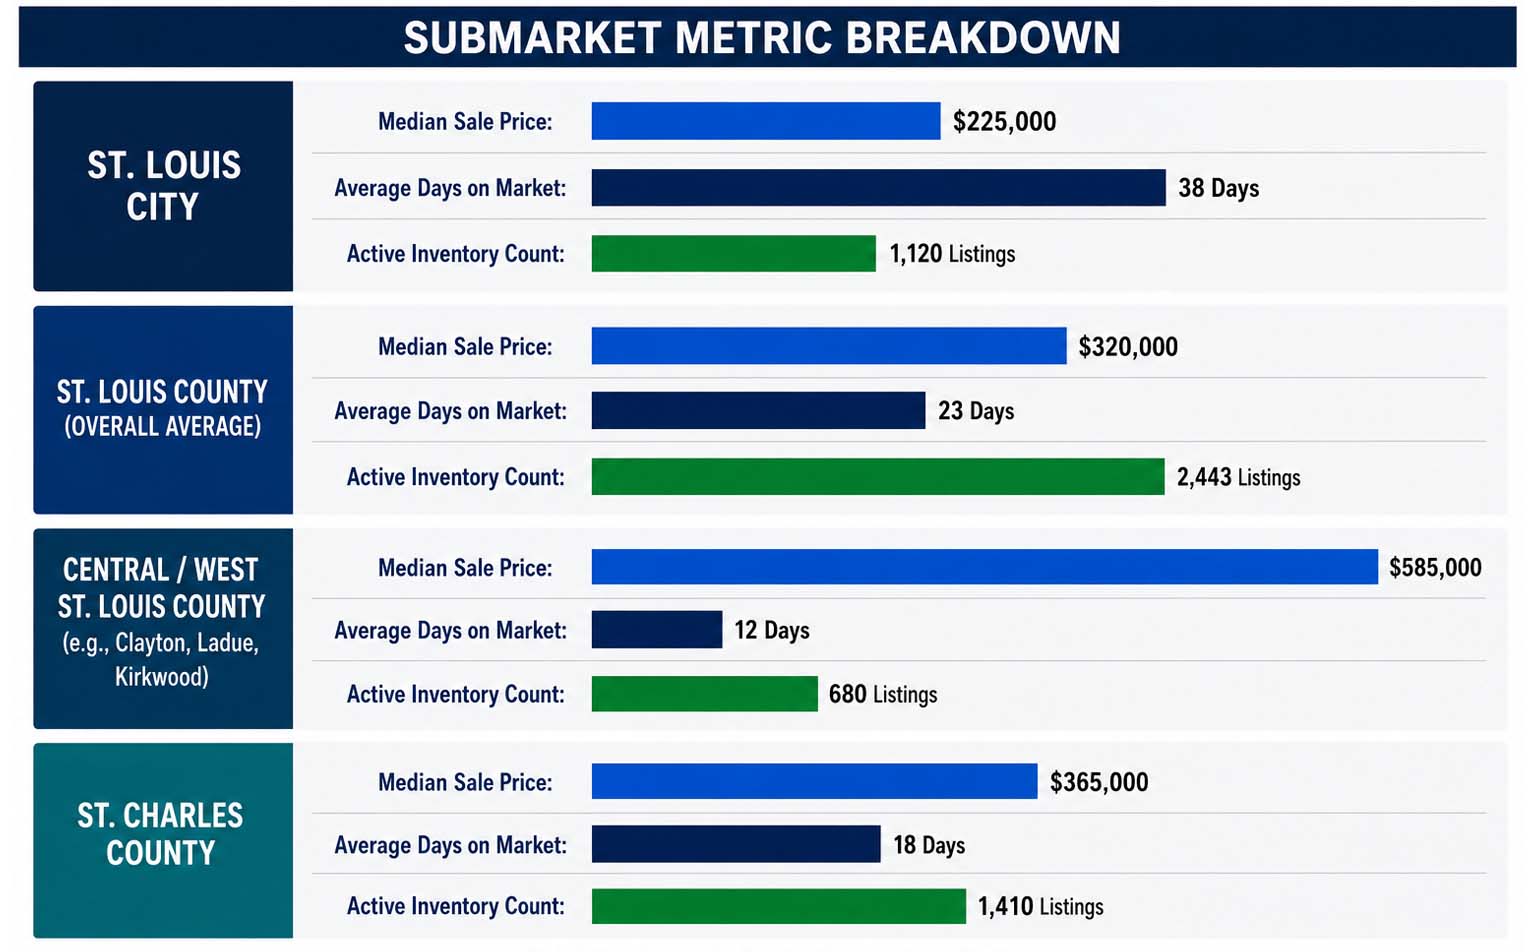
Data Source: St. Louis REALTORS® / MARIS Regional Reports (July 2026 Data Released August 2026). Geographic Scope: St. Louis City vs. St. Louis County vs. St. Charles County
Analysis of Graph 2: Geographic Disparities in Sales Velocity
Graph 2 highlights the profound impact that local geography exerts on sales velocity and property valuations across the metropolitan footprint.
In St. Louis City, listings average 38 days on market with a median sale price of $225,000 across 1,120 active units. While historic neighborhoods with architectural character—such as Tower Grove South, Lafayette Square, and the Central West End—maintain steady demand for renovated brick inventory, homes in other city pockets sit significantly longer due to buyer concerns over deferred structural maintenance, tuckpointing requirements, and municipal compliance standards.
Conversely, premier Central and West St. Louis County submarkets—including Kirkwood, Webster Groves, Clayton, and Ladue—operate at rapid velocity, averaging just 12 days on market with a median sale price of $585,000. In these high-demand suburban pockets, buyer demand heavily outstrips the available 680 active listings, driven by top-ranking school districts and limited land for new construction.
Meanwhile, St. Charles County maintains a median sale price of $365,000 and an average velocity of 18 days on market. Suburban master-planned communities in O'Fallon, St. Peters, and Wentzville provide buyers with newer construction floor plans and modern mechanical systems. This inventory puts competitive pressure on older mid-century housing stock in North and South St. Louis County. A seller with a 1960s ranch in Florissant or Affton who prices their home against newer suburban inventory without offering comparable interior updates will face extended market stagnation.
Comprehensive St. Louis Market Snapshot
To provide a complete comparative view of regional metrics, the single structured data table below outlines the core market indicators across major local divisions.
ST. LOUIS REGIONAL HOUSING MARKET SNAPSHOT
| Market Indicator | St. Louis City | St. Louis County | St. Charles County | Metro Aggregate / Trend |
|---|---|---|---|---|
|
Active Single-Family Listings |
1,120 Units |
2,443 Units |
1,410 Units |
5,850+ Units (+15.2% YoY) |
|
Median Closed Sale Price |
$225,000 |
$320,000 |
$365,000 |
$310,000 (+8.47% County) |
|
Median Active List Price |
$210,000 |
$250,000 |
$375,000 |
$295,000 (-13.76% County) |
|
Average Days on Market (DOM) |
38 Days |
23 Days |
18 Days |
26 Days (Widening Spread) |
|
Months of Available Supply |
3.85 Months |
3.16 Months |
2.45 Months |
3.20 Months (+50% YoY) |
|
Listings with Price Reductions |
21.40% |
17.90% |
14.20% |
17.90% (+1.1% pts YoY) |
|
Sale-to-Original-List Ratio |
96.80% |
98.40% |
99.10% |
98.10% (Turnkey >100%) |
Interpretation of Table 1: Key Takeaways for Homeowners
Table 1 provides clear benchmarks for evaluating where a property stands relative to market realities.
A critical relationship to examine is between Months of Available Supply and the Sale-to-Original-List Ratio. In St. Louis City, where supply stands at 3.85 months, more than 21% of active properties have undergone price reductions, and closed transactions average 96.80% of original list price.
In St. Louis County, the aggregate 98.40% sale-to-list ratio conceals the underlying market bifurcation: move-in-ready properties in desirable school districts regularly achieve 101% to 103% of asking price, while stagnant properties that undergo price reductions ultimately close at 90% to 94% of their initial list price.
When regional inventory expands toward 3 to 4 months of supply, buyer behavior fundamentally changes. Purchasers no longer feel pressured to submit unconditional offers on flawed properties. Sellers who fail to account for these operational thresholds face diminishing leverage with each passing week.
Detailed Breakdown: Why Your St. Louis Listing Is Stalled
If your home has exceeded 21 days on the market without producing written offers, your listing is likely encountering one or more of the following structural bottlenecks.
Bottleneck 1: Algorithmic Search Filter Exclusion
The vast majority of property discovery occurs via digital real estate portals. Buyers configure search filters in rigid price bands (such as $250,000 to $300,000 or $300,000 to $350,000).
If your home has a true fair market value of $295,000 based on recent neighborhood comps, but you list at $319,900 to "leave room for negotiation," you create two immediate problems:
-
You expose the home to buyers with budgets up to $350,000 who are simultaneously touring superior, fully updated homes, making your property look overpriced by comparison.
-
You completely hide the property from qualified buyers searching within the $250,000 to $300,000 bracket who would view your home as an outstanding opportunity.
In today's digital MLS ecosystem, listing above the market ceiling suppresses discovery during the vital first two weeks of listing exposure.
Bottleneck 2: High Showing Volume with Zero Written Offers
When a property generates steady showing traffic (e.g., 4 to 6 tours per week) but fails to produce written offers after two or three weeks, the digital listing and price point are doing their job: attracting prospective buyers.
However, the physical showing experience is failing to meet the expectations established by the online presentation. Common friction points cited in local agent feedback include:
-
Environmental and Pet Odors: Lingering pet smells, cigarette smoke residue, moldy basement dampness, or heavy synthetic masking sprays that make buyers suspect underlying moisture issues.
-
Visible Deferred Maintenance: Curling roof shingles, aging water heaters, rust around furnace units, or visible settling cracks in basement foundation walls.
-
Awkward Floor Plans or Poor Lighting: Dimly lit living areas, heavy drapes blocking natural sunlight, cluttered rooms that appear small, or non-traditional layouts (such as walking through one bedroom to access another).
Bottleneck 3: Digital Asset and Presentation Deficiencies
Over 90% of buyers review listing photos on mobile screens before scheduling an in-person showing. Listings that feature dark, blurry cell phone photos, unmade beds, cluttered kitchen countertops, or vertical image orientations fail to capture buyer interest.
In competitive submarkets across South City or Florissant, where numerous mid-century brick homes compete for attention, professional high-dynamic-range (HDR) photography and detailed 2D floor plans are critical marketing requirements.
Bottleneck 4: Listing Fatigue and Market Stigma
The MLS marketplace places an enormous premium on freshness. In St. Louis County, listings generate peak showing activity during their initial 14 days on market. Once a property passes 21 to 30 days without entering pending status, buyer agents and their clients begin to ask: "What is wrong with that property?"
Buyers assume the seller is growing desperate, leading either to a total cessation of showing requests or aggressive lowball offers well below fair market value.
Action Plan: Practical Strategies to Sell Your St. Louis Home
If your listing has stalled, doing nothing is the costliest decision you can make. Every additional week on market increases carrying costs—including mortgage interest, property taxes, insurance, and utility expenses—while weakening your negotiating leverage.
Below is a diagnostic framework for adjusting your strategy based on your property's specific condition and circumstances.
Strategy 1: Execute a Strategic, Search-Bracket Price Adjustment
If showing volume is low (fewer than two showings per week after the second week), a minor price reduction of $2,000 or $5,000 will not resolve the issue. Small cuts fail to trigger new buyer search alerts and signal seller reluctance.
-
The 5% to 8% Rule: An effective price reduction must lower the asking price by at least 5% to 8%, moving the listing into a lower search bracket (e.g., reducing from $315,000 to $299,000).
-
Resetting Search Feeds: Crossing a major pricing threshold triggers automated email alerts to buyers who were previously priced out, sparking a second wave of showings.
-
Marketing Relaunch: Combine the price reduction with refreshed marketing assets, such as updated lead photos or a revised description emphasizing high-value features.
Strategy 2: High-ROI Cosmetic and Presentation Improvements
If you are getting showings but no offers, focus on targeted, cost-effective updates rather than major structural renovations:
-
Neutral Interior Paint: Paint main living spaces in light, neutral tones (such as warm off-white or soft greige). Fresh paint eliminates odors, brightens rooms, and creates a clean canvas for buyers.
-
Hardware and Lighting Upgrades: Swap out dated brass fixtures, worn cabinet knobs, and old bathroom vanity lights for modern matte black or brushed nickel fixtures.
-
Professional Deep Cleaning and Decluttering: Move excess furniture, personal family photos, and countertop clutter into an off-site storage unit. Clean carpets, wash interior windows, and scrub tile grout.
-
Curb Appeal Enhancements: Edge garden beds, lay fresh dark mulch, trim overgrown landscaping, power-wash exterior siding, and add welcoming seasonal planters near the entryway.
Strategy 3: Offer Creative Financing Concessions
With mortgage rates impacting affordability, cash-to-close requirements represent a major hurdle for St. Louis buyers. Rather than simply reducing your listing price by $10,000, consider offering a $10,000 Seller Credit Toward a Temporary Rate Buydown or Closing Costs.
-
The Impact of a 2-1 Buydown: A temporary 2-1 buydown lowers the buyer's mortgage interest rate by 2.0% in year one and 1.0% in year two, significantly reducing their initial monthly payment.
-
Seller Benefit: Offering a financing credit often provides greater monthly savings to a buyer than a direct price cut of equal value. This expands your buyer pool while protecting your contract price.
Strategy 4: The Direct As-Is / Cash Sale Option
For property owners managing inherited estates, major structural defects (such as severe foundation settling, broken sewer laterals, or storm-damaged roofs), or urgent relocation timelines, traditional retail listing preparation may not be practical.
Under Missouri probate or complex estate administration, managing contractor bids, municipal occupancy inspections, and buyer financing contingencies can take months. As noted by the
Practical Takeaways for Market Participants
For Home Sellers
-
Track the 14-Day Velocity Window: If your listing produces fewer than five total showings in its first two weeks, your asking price is misaligned with current competition. Make an adjustment before the listing becomes stale.
-
Price Against Active Competition: Closed sales from 60 days ago define your appraisal ceiling, but active listings in your immediate neighborhood represent your direct competition. Price your property against what buyers are touring today.
-
Prepare for Municipal Inspections Early: Many municipalities across St. Louis County (such as Florissant, University City, and Kirkwood) require strict municipal occupancy inspections. Order these inspections early to identify and address repair requirements before going under contract.
For Home Buyers
-
Target Listings with 21+ Days on Market: Focus on properties that have been active for more than three weeks. These listings often feature motivated sellers who are open to price negotiations, repair credits, and closing cost assistance.
-
Look Past Cosmetic Flaws: Outdated wallpaper, worn carpeting, and bold paint colors scare away casual buyers, creating negotiation opportunities for buyers willing to handle cosmetic updates after closing.
-
Request Rate Buydown Credits: Instead of submitting lowball offers on well-located properties, ask the seller for closing credits to buy down your mortgage interest rate, maximizing your monthly savings.
For Real Estate Investors
-
Acquire Motivated Track 2 Inventory: With 17.9% of metro listings reducing prices, acquisition opportunities exist among properties requiring cosmetic modernization. Focus on submarkets with strong rental fundamentals.
-
Leverage Strong Rental Fundamentals: As detailed in the
Colliers St. Louis Q2 2026 Multifamily Report -
Accurately Budget Renovation Costs: Do not rely on outdated cost estimates. Secure current line-item bids for masonry, HVAC, and roof repairs before submitting as-is cash offers.
What to Watch During September 2026
As the market transitions into the post-Labor Day autumn selling season, keep an eye on these key local indicators:
-
Active Inventory Trajectory: Track whether active single-family listings maintain their current ~3,560+ unit volume or begin an early autumn seasonal contraction.
-
Mortgage Rate Fluctuations: Follow weekly mortgage rate surveys. Even a 25 to 50 basis point shift in borrowing rates directly affects purchasing power for mid-tier buyers in St. Louis County.
-
Price Reduction Percentages: Monitor whether the share of active listings with price cuts rises above the 18% to 20% mark, which would signal broader pricing adjustments across suburban submarkets.
-
Days on Market Spread: Watch the velocity gap between turnkey homes and fixer-upper properties across St. Louis City and County to gauge changing buyer sentiment.
Conclusion: Adapting Your Strategy to Today's Market
If your St. Louis house is not selling, the market is not broken—it is simply providing clear feedback. Today's buyers have 15.2% more options than they did a year ago, months of supply have expanded to 3.16 months in St. Louis County, and nearly 18% of active sellers across the region have lowered their prices to stay competitive.
Successfully selling a home in late 2026 comes down to aligning your property with current market realities:
-
If your home is in move-in condition, price it accurately based on recent closed comps rather than aspirational list prices.
-
If your property needs cosmetic work, either invest in targeted, high-ROI updates or offer buyer concessions to offset their near-term repair costs.
-
If repair expenses, probate timelines, or relocation deadlines make a traditional retail listing impractical, consider an as-is cash sale for speed and certainty.
By looking at local market data objectively, evaluating buyer feedback, and making strategic adjustments to price and presentation, you can remove buyer friction and successfully move your property from active to sold.
Ready to Buy or Sell in St. Louis? House Sold Easy Has You Covered!
Whether you're thinking about listing your home or exploring a cash offer, it's worth understanding all of your options before making a decision. The right choice depends on your timeline, your property's condition, and your goals. Contact House Sold Easy to discuss your situation and see what makes the most sense for you.Our St. Louis experts know every corner of this city and will make buying your dream home or selling your high-end property a breeze. Don’t miss out on the hottest market in the U.S.! Contact House Sold Easy today and let’s make your real estate goals happen!