St. Louis Home Inventory Up 15%: What Sellers Need to Know
Sep 01, 2026
Written by House Sold Easy Team
Introduction: The Shifting Balance in the Gateway City
St. Louis home sellers are encountering a market landscape they rarely had to navigate during the hyper-accelerated peak years of the post-pandemic housing cycle: authentic, measurable competition from neighboring property listings. According to comprehensive market intelligence released in late August 2026 by St. Louis REALTORS® and the Mid America Regional Information Systems (MARIS), active single-family inventory across the St. Louis metropolitan footprint reached 3,563 available properties in July 2026. This performance metric represents an unmistakable 15.2% year-over-year expansion compared to the 3,093 homes available on the market during the same period in July 2025.
At the very same time, top-line residential pricing has completely defied conventional historical assumptions about inventory surges. Rather than triggering price deterioration, widespread discounting, or capital flight, the median single-family sales price across St. Louis climbed 5.9% over the past twelve months to reach a robust $350,000.
This striking statistical juxtaposition—housing inventory expanding at a double-digit clip while median sold prices climb to new cycle highs—presents an intricate operational reality across eastern Missouri. The St. Louis real estate market has officially graduated from the broad, sweeping generalizations of a generic "seller's market" or "buyer's market." Instead, micro-market bifurcations between St. Louis City, St. Louis County, and neighboring suburban enclaves are dictating real-world transaction outcomes. Sellers no longer hold unilateral control over contract terms, buyers are selectively asserting leverage on aged inventory, and residential investors are targeting emerging pricing inefficiencies across the metropolitan area.
To make sound real estate decisions heading into the final quarter of 2026, homeowners, prospective purchasers, and portfolio investors must look past national headlines. The national housing narrative frequently conflates Sunbelt oversupply or coastal valuation retreats with Midwestern stability. St. Louis remains fundamentally insulated by affordable entry points, diverse corporate employment hubs, and an established housing stock. However, the internal mechanics of how homes are priced, marketed, negotiated, and closed have experienced their most significant structural shift in four years.
Understanding this new dynamic requires examining the subtle forces behind the headline numbers. Inventory is not rising because demand has evaporated into thin air; rather, demand has become hyper-selective. Buyers armed with 6.5%+ mortgage pre-approvals are refusing to compromise on condition, while sellers who held off during the early months of the year are finally listing their properties. This creates a market characterized by friction, where certain properties sell in a weekend with multiple offers while others sit for two months without a single showing. Navigating this environment demands a granular, data-driven approach rooted in hyper-local market realities.
Current St. Louis Market Context: Anatomy of a Late-Summer Supply Surge
To understand why residential inventory is expanding steadily while closed sale prices continue to appreciate, one must dissect the intersection of regional seasonal rhythms, persistent macroeconomic headwinds, and evolving seller psychology across the Greater St. Louis area.
For the past several years, the well-documented "mortgage rate lock-in effect" severely suppressed residential listings across Greater St. Louis. Homeowners who secured or refinanced into 30-year fixed mortgages between 2.75% and 3.50% during 2020 through 2022 resisted listing their properties. Moving meant trading an exceptionally low debt service for a prevailing mortgage rate exceeding 6.50%. This dynamic created an artificial supply drought that propped up prices and generated intense bidding wars on virtually every listed property throughout 2023, 2024, and early 2025.
However, by mid-2026, natural household life-stage transitions—family expansions, corporate relocations, divorces, downsizings, and estate probate settlements—began overwhelming rate hesitation. Life events cannot be delayed indefinitely. Sellers who hesitated during the congested spring selling window entered the market throughout July and August to capture the late-summer buyer pool before the 2026–2027 academic school year commenced, as detailed in market commentary from The Gentry Group.
Simultaneously, borrowing costs have established a firm higher baseline. According to Freddie Mac primary mortgage market survey data reported via Yahoo Finance, the 30-year fixed-rate mortgage averaged 6.66% in late August 2026. Institutional economic forecasts from Fannie Mae project mortgage rates to hover near 6.80% through the end of the year.
Higher borrowing costs have fundamentally altered consumer purchasing power. St. Louis buyers are actively attending open houses, scheduling private tours, and securing financing, but they are evaluating monthly debt obligations with absolute mathematical discipline. When prospective buyers encounter an overpriced home or a property requiring immediate capital expenditure for structural, electrical, or cosmetic remediation, they walk away rather than bidding up the purchase price. Consequently, homes lacking turnkey presentation or realistic initial asking prices linger on the MLS, steadily accumulating as active inventory.
Furthermore, new construction in the outer suburban periphery has begun contributing to overall inventory volume. Builders in western St. Louis County and St. Charles County have steadily delivered new inventory throughout 2026, offering rate buydowns and closing cost incentives that compete directly with existing home sellers. This adds layer of competition for sellers of older, existing homes who may not have the margin or inclination to offer similar financial concessions.
GRAPH 1: ST. LOUIS SINGLE-FAMILY ACTIVE LISTINGS & MEDIAN SALE PRICE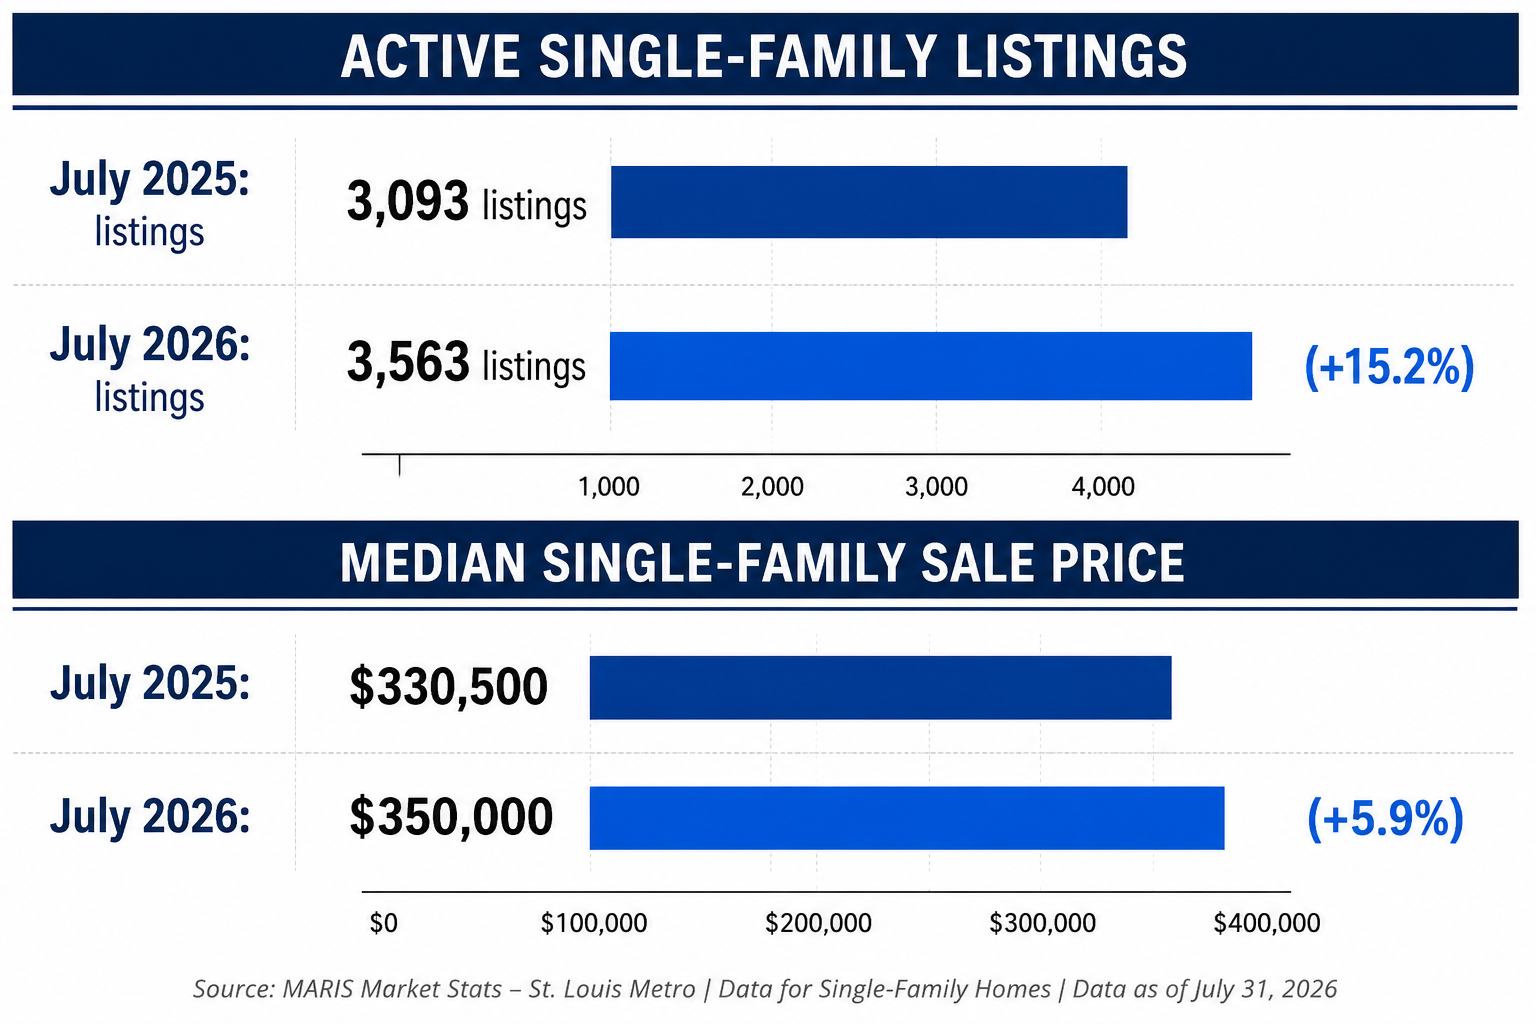
Graph 1 illustrates the core operational reality of the current St. Louis market: active inventory expansion has not caused an immediate structural decline in closed transaction values. The 15.2% expansion in available single-family inventory from 3,093 to 3,563 units reflects a steady influx of listings alongside lengthened marketing timelines. Yet, because closed transaction volume remains concentrated among move-in-ready, highly desirable homes, the median sales price climbed from approximately $330,500 in July 2025 to $350,000 in July 2026.
This divergence is critical for market participants to understand. In a traditional softening market, inventory surges are accompanied by price declines as sellers compete on price to attract scarce buyers. In St. Louis today, buyers are still present in large numbers, but they are funneling their capital into the top tier of listings—those that are properly priced, professionally staged, and mechanically sound. The homes that make up the 15.2% inventory increase are disproportionately those that missed the mark on price or condition, sitting active on the market while the best homes continue to set record sales prices.
Latest Market Data and Deep-Dive Metric Analysis
A comprehensive examination of regional market data confirms that the July and August 2026 inventory growth is occurring across multiple property classifications and geographic tiers. Regional figures compiled in the Homes.com Saint Louis Housing Market Report document 9,864 total residential properties for sale across the Greater St. Louis metropolitan area in July 2026. This reflects a 13.9% year-over-year increase, representing one of the most substantial supply rebounds among major Midwestern metropolitan statistical areas.
To fully understand the mechanics behind this trend, we must look into the secondary metrics shaping closed transactions across the region:
Single-Family Supply vs. Multi-Unit Inventory
Metropolitan single-family homes for sale grew 14.8% year-over-year, driven by a combination of new construction deliveries in outer suburban rings and existing homeowners listing properties. Meanwhile, multi-unit residential properties (2–4 units) experienced a more modest 8.2% increase in active listings. This indicates that private residential landlords are holding onto cash-flowing assets in urban pockets while single-family owner-occupants are driving the transaction volume.
County-Level Supply Accumulation
In St. Louis County specifically, active residential listings reached 4,225 active properties by late summer, expanding months of inventory supply to 3.16 months, according to MLS reporting curated by House Sold Easy. This marks the highest County supply reading recorded in late summer since 2019, providing buyers with an unprecedented breadth of selection compared to recent cycles.
The Rising Frequency of Price Reductions
As of mid-August 2026, 17.9% of all active residential listings across Greater St. Louis logged at least one asking-price reduction. This represents an increase of 1.1 percentage points over the prior year. This statistic proves that initial listing overconfidence is being systematically corrected by the open market. Sellers who test aspirational price tags without corresponding physical upgrades are forced to cut prices within 20 to 30 days of hitting the MLS.
The Two-Track Velocity Split
While the metropolitan average days on market (DOM) held steady at 23 days, this aggregate figure conceals a bifurcated market. Turnkey properties priced accurately under $450,000 frequently secure binding contracts within 4 to 7 days, often with multiple offers. Conversely, properties requiring cosmetic or mechanical overhaul regularly surpass 44 days on market, skewing the overall market perception.
Metropolitan Price Appreciation Dynamics
Across all residential property types in the metro area, the median sale price rose 3.7% year-over-year to $310,000 in July 2026, outpacing the national price appreciation rate of 2.6%. This points to the steady underlying demand for St. Louis real estate relative to more volatile coastal markets.
This multi-tiered data environment underscores the importance of looking beyond single metrics. A headline stating that "average days on market is 23 days" might lead a seller to believe they have three weeks to find a buyer. In reality, if their home is in a high-demand school district and priced correctly, they will likely have offers in hand by Monday following a weekend launch. If their home is overpriced by $20,000, they could easily sit for 60 days before seeing a viable contract.
Local Geographic Divergence: City vs. County Dynamics
Analyzing the St. Louis housing market requires distinguishing between municipal jurisdictions. St. Louis City and St. Louis County operate under distinct supply constraints, tax structures, housing stock vintages, and buyer demographics. Treating them as interchangeable leads to flawed pricing strategies and unrealistic expectations.
In St. Louis County, closed sales achieved a median sold price of $320,000 in July 2026, marking an 8.47% annual gain according to MORE, REALTORS® August 2026 Market Update. In contrast, St. Louis City recorded a median sold price between $261,000 and $265,000, reflecting more modest annual appreciation ranging from 0.77% to 6.9% depending on property subtype, as detailed by Hermann London Real Estate.
GRAPH 2: MONTHS OF HOUSING INVENTORY SUPPLY BY JURISDICTION
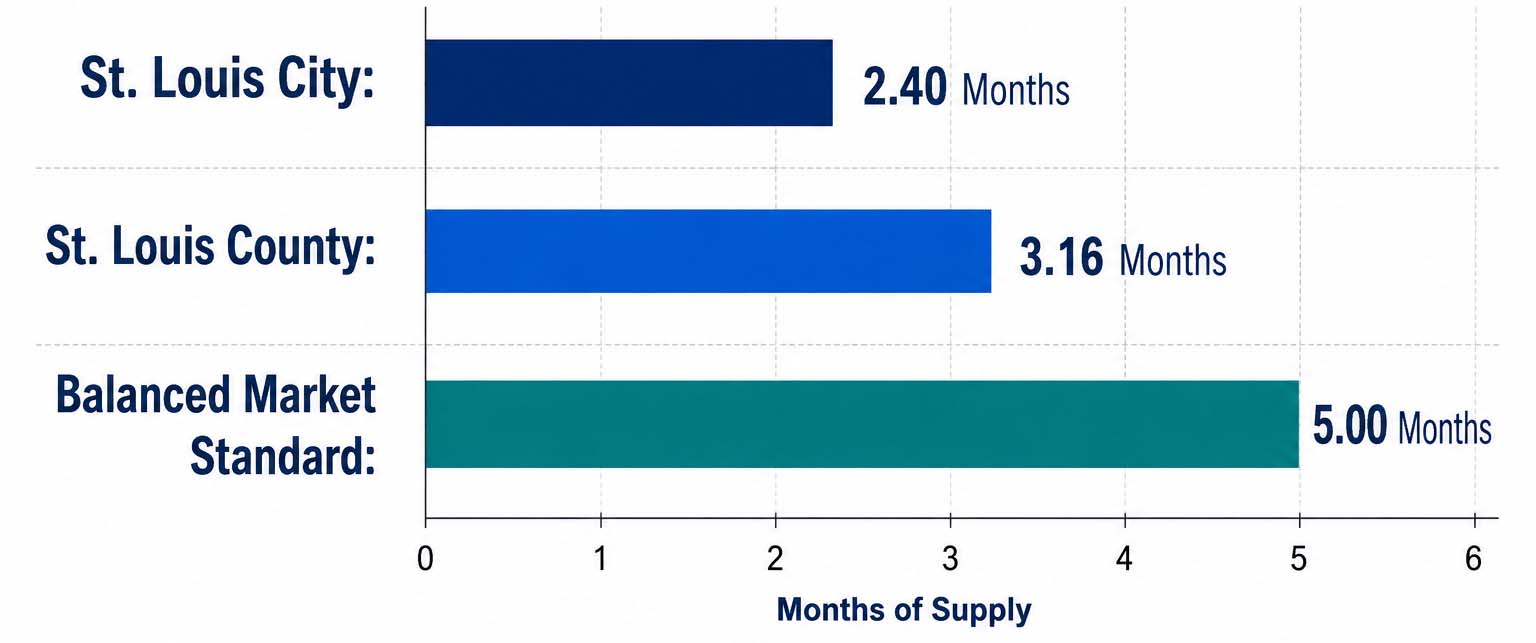
Graph 2 outlines the comparative supply health between jurisdictions relative to the standard 5.0-month threshold of a fully balanced market. At 2.40 months of supply, St. Louis City retains a lower overall volume of active inventory relative to its transaction pace, insulated by dense urban neighborhoods like Soulard, Tower Grove South, and the Central West End. However, price appreciation in the City has moderated as buyers weigh municipal property tax rates and renovation costs.
Conversely, St. Louis County’s expansion to 3.16 months of supply demonstrates a stronger listing influx across inner-ring suburbs and outer commuter corridors alike. While the County maintains an inventory cushion that gives buyers more negotiating room, its higher median sale price ($320,000) shows that suburban housing demand remains resilient.
Detailed Submarket Analysis Across the Region
Central and West County Corridors:
In premier municipal enclaves such as Clayton, Ladue, Kirkwood, Town and Country, and Webster Groves, supply remains remarkably tight for fully renovated single-family homes. High demand for top-rated school districts continues to fuel competitive offer situations for turnkey inventory under $600,000. Properties in these prime submarkets frequently sell above list price if mechanical systems, roofs, and interior aesthetics are modern. However, larger estate homes priced above $1.2 million that have not been updated since the 1990s are seeing noticeable price adjustments and extended market times.
Outer Subdivisions and Established Enclaves:
Outer suburban markets are experiencing longer absorption timelines. In Chesterfield, residential properties averaged 14 days to sell by mid-August 2026—a 75% increase in marketing time compared to the previous year, as documented in regional tracking from Pecan Street Advisors. While 14 days remains historically fast, the sharp percentage increase demonstrates that suburban buyers are taking more time to evaluate competitive options across different subdivisions before making offers.
North County Submarkets:
Communities such as Florissant, Hazelwood, and Ferguson continue to provide accessible entry-level price points ($150,000–$220,000). However, higher mortgage rates have cooled FHA and conventional financing velocity, resulting in gradual inventory accumulation. In these submarkets, buyer assistance programs and seller-paid closing cost concessions have become standard negotiation requirements. Homes needing occupancy inspection repairs often face prolonged delays if sellers cannot fund pre-sale repairs.
South County and St. Charles County:
South County enclaves like Mehlville, Oakville, and Affton maintain steady, balanced absorption, appealing to buyers seeking suburban infrastructure without West County price premiums. Meanwhile, St. Charles County across the Missouri River (including O'Fallon, St. Peters, and Wentzville) continues to see active residential development, capturing buyers priced out of central St. Louis County with newer construction inventory and modern master-planned amenities.
Urban City Neighborhoods:
Within St. Louis City, performance varies significantly by neighborhood pocket:
-
Tower Grove South and Shaw: These historic districts remain popular among young professionals and healthcare workers, with updated brick two-stories commanding strong pricing, though marketing timelines have extended from 5 days to roughly 18 days.
-
Central West End (CWE): High-end condominium sales have experienced slower absorption due to HOA fees and elevated interest rates, while renovated single-family homes near Forest Park continue to command premium price-per-square-foot valuations.
-
Soulard and Benton Park: Historic row homes and multi-family conversions maintain steady demand, driven by lifestyle appeal and short-term rental/owner-occupant hybrid buyers.
-
Downtown St. Louis: The downtown loft and condominium market continues to face headwinds, with inventory exceeding 6 months of supply and extended days on market reflecting broader commercial-to-residential transition patterns.
Comprehensive St. Louis Market Snapshot
The table below compiles July 2026 performance metrics across St. Louis City, St. Louis County, and the broader Metropolitan Statistical Area, utilizing verified data released throughout August 2026.
| Market Indicator | St. Louis City | St. Louis County | Greater St. Louis Metro |
|---|---|---|---|
|
Median Sold Price |
$261,000 – $265,000 |
$320,000 |
$310,000 |
|
YoY Median Price Change |
+0.77% to +6.90% |
+8.47% |
+3.70% |
|
Active Residential Inventory |
Moderate expansion |
4,225 listings |
9,864 listings |
|
YoY Inventory Change |
Positive growth |
+15.2% (Single-Family) |
+13.9% (All Types) |
|
Months of Supply |
~2.40 months |
3.16 months |
~2.80 months |
|
Listings with Price Reductions |
~16.5% |
~18.2% |
17.9% |
|
Average Days on Market (DOM) |
28 days |
21 days |
23 days |
Table 1: St. Louis Regional Real Estate Snapshot (July 2026 Data Released August 2026). Sources: MARIS, St. Louis REALTORS®, MORE REALTORS®, Homes.com, House Sold Easy.
Table 1 highlights the fundamental divergence between geographic boundaries. St. Louis County leads the region in nominal equity growth, posting an 8.47% price jump to $320,000 alongside a brisk 21-day average marketing timeline. However, the County also exhibits a higher share of price-reduced properties (18.2%) and elevated inventory (4,225 active listings), confirming that County buyers are quick to penalize listings that overshoot comparable sales.
Across the wider metro area, the 17.9% price reduction metric confirms that roughly one in every six active sellers has had to drop their initial price to align with current demand. This snapshot proves that while aggregate values remain structurally solid, transaction success requires hyper-accurate initial positioning.
The data in Table 1 also reveals the contrasting market realities faced by urban versus suburban sellers. While City inventory remains relatively tight at 2.40 months of supply, the longer average days on market (28 days) and wider range of price appreciation (+0.77% to +6.90%) reflect a market where property condition and neighborhood block dynamics play an outsized role in buyer decisions. In St. Louis County, higher transaction volumes and stronger median price gains (+8.47%) demonstrate resilient suburban demand, but the 3.16 months of supply means buyers have more active listings to choose from than at any point in the last several years.
What This Means for St. Louis Home Sellers
For homeowners preparing to list in late summer or early fall 2026, the 15.2% jump in single-family inventory demands a fundamental shift in mindset and strategy. The market environment where sellers could dictate terms, ignore basic maintenance, and set aspirational asking prices has definitively ended.
1. The Pricing Gap Penalty and List-Price Reality
MLS tracking throughout August highlighted a telling disparity: while the median sold price in St. Louis County reached $320,000, the median list price settled near $250,000. This numerical spread occurs because entry-level and mid-tier inventory lists aggressively to capture buyer pools, while overpriced upper-tier listings sit idle until adjusted. Overpricing your home by even 4% to 6% in this environment risks exceeding standard search filters, stranding the property past the critical 21-day mark where buyer engagement declines precipitously.
In practical terms, if comparable sales in your Kirkwood or Florissant neighborhood suggest a fair market value of $340,000, listing at $365,000 to "leave room for negotiation" is often counterproductive. Today's buyers simply filter out homes above their strict budget threshold. Instead of generating low offers, an overpriced listing typically generates no showings at all, forcing price cuts weeks later after the listing has lost its fresh-market appeal.
2. The Move-In Ready Mandate
With 30-year fixed rates at 6.66%, typical buyers face substantial monthly carrying costs. Consequently, they possess less post-closing cash reserves for immediate renovations. Properties featuring updated electrical panels, modern HVAC systems, compliant municipal occupancy inspections, and modern kitchens command multiple bids. Conversely, properties requiring cosmetic modernization or system replacements sit on the market, frequently yielding offers below list price coupled with substantial seller concession requests.
Sellers should pay close attention to the following property preparation areas:
-
Municipal Occupancy Compliance: Ensure all municipal inspections (required by most St. Louis County municipalities and the City of St. Louis) are completed or pre-inspected to avoid last-minute closing delays.
-
Mechanical Systems: Furnaces, air conditioning units, and water heaters older than 15 years should be serviced and certified. Providing buyers with receipts for recent maintenance removes a primary source of buyer hesitation.
-
Cosmetic Upgrades: Fresh neutral interior paint, professional carpet cleaning or replacement, and modern light fixtures deliver the highest return on investment in today's market.
-
Curb Appeal and Staging: First impressions matter more than ever. Professional photography and decluttered, well-staged living areas directly influence whether a buyer requests an in-person showing.
3. Strategic Selling Options: Traditional Listing vs. Direct As-Is Sale
Sellers must evaluate their physical asset, financial flexibility, and personal timeline before selecting an execution path:
-
The Traditional MLS Listing Route:
Best suited for well-maintained, modernized homes in sought-after school districts and high-demand neighborhoods. Sellers taking this path should invest in pre-listing municipal inspections, professional staging, and targeted digital marketing to capture early buyer traffic within the first 10 days of listing. If your home is move-in ready and priced in alignment with recent closed comps, the traditional route remains the best way to maximize gross proceeds.
-
The Direct As-Is Cash Sale Route:
For properties with significant deferred maintenance, aging roofs, foundation settling, outdated electrical wiring (such as knob-and-tube), or inherited estate complications, the traditional listing process can lead to repeated price reductions, difficult inspection negotiations, and financing fallout. A direct sale to an established local cash buyer eliminates inspection contingencies, appraisal shortfalls, and municipal repair mandates, providing transactional certainty, zero commissions, and flexible closing timelines.
4. Managing Showings and Early Offers in a 15% Higher Inventory Market
When listing in an environment with rising inventory, the first 14 days on market represent your highest-leverage window. Sellers should ensure maximum showing availability during this initial period. If showings are steady but no offers materialize within the first two weeks, it is a clear indicator that buyers perceive the property's value as misaligned with its asking price. Being prepared to execute a strategic price correction between days 14 and 21 can prevent the listing from stagnating and ultimately selling for less than it would have with an early adjustment.
What This Means for St. Louis Home Buyers
For prospective homebuyers, the late-summer inventory expansion provides tangible breathing room, broader selection, and enhanced contractual leverage compared to the restrictive conditions of 2023–2025.
1. Expanded Selection Without Price Collapses
With nearly 10,000 homes available across the metro, buyers no longer face an extreme supply shortage. You can inspect multiple properties across adjoining neighborhoods—such as comparing housing stock in Kirkwood versus Webster Groves, or South City versus Maplewood—before submitting an offer. However, because metro-wide median prices rose 3.7%, buyers should not expect steep across-the-board discounts on pristine listings.
The key advantage for buyers today is time and choice. Instead of having to tour a home on a Friday afternoon and submit a sight-unseen offer by Saturday morning, buyers in many submarkets can take a weekend to review disclosures, research school boundaries, and evaluate comparable sales before structuring a thoughtful offer.
2. Target the 17.9% Price-Reduced Pool
The most fertile ground for buyer negotiations lies within the 17.9% of listings that have executed price reductions. When a property crosses 30 to 45 days on market, seller motivation typically shifts from maximizing price to securing a dependable closing. Buyers targeting these properties can successfully negotiate:
-
Seller-Paid Rate Buydowns: Direct seller credits toward permanent or temporary mortgage rate buydowns (such as a 2-1 buydown structure that reduces the interest rate by 2% in Year 1 and 1% in Year 2) can save buyers hundreds of dollars per month on their debt service.
-
Comprehensive Repair Resolutions: Rather than waiving inspections—a risky practice common during 2021–2022—buyers today should insist on comprehensive building, termite, radon, and lateral sewer line inspections, requesting formal repair credits or remediation before closing.
-
Home Sale Contingencies: Sellers of aged inventory are far more receptive to offers contingent upon the sale of the buyer's existing home, providing a safer pathway for move-up buyers.
-
Closing Cost Assistance: First-time buyers can request 2% to 3% in seller concessions to offset out-of-pocket closing fees, title charges, and prepaid escrows.
3. Underwrite Monthly Debt, Not Future Refinancing
At an interest rate of 6.66%, the monthly principal and interest payment on a $300,000 loan balance is approximately $1,928. By comparison, that same balance at a 4.0% rate required roughly $1,432 per month. Adding St. Louis County property taxes (typically 1.3% to 1.8% of assessed value) and homeowner's insurance pushes total monthly housing costs to $2,400–$2,600.
Buyers must ensure their household budget comfortably supports the existing payment schedule without banking on immediate Federal Reserve rate cuts to refinance. If interest rates drop in 2027 or 2028, refinancing will provide welcome monthly savings; however, purchasing a home that strains your finances today based on the hope of future rate relief is an unnecessary financial risk.
4. Competitive Strategies for Move-In Ready Homes
While negotiation leverage has increased on dated homes, turnkey properties in high-demand pockets like Ladue, Clayton, Kirkwood, and Tower Grove South still attract multiple offers. When pursuing these competitive listings, buyers should:
-
Secure a fully underwritten pre-approval letter (not just an automated pre-qualification) from a respected local St. Louis lender.
-
Include an escalation clause with a clear maximum cap rather than submitting an unnecessarily high initial bid.
-
Offer a flexible closing date that accommodates the seller's relocation schedule.
-
Keep earnest money deposits substantial (typically 1% to 2% of the purchase price) to demonstrate financial seriousness.
What St. Louis Real Estate Investors Should Watch
The late-summer 2026 data presents compelling, targeted opportunities for residential real estate investors, provided acquisitions are underwritten with strict financial discipline.
1. Expanding Acquisition Pipelines and Distressed Inventory
As active listings climb 15.2% and suburban properties average longer marketing periods, motivated sellers are increasingly open to creative and cash terms. Investors targeting single-family rentals (SFR) and small multi-family assets can find viable opportunities among landlords exiting the market, tired rental owners dealing with tenant turnover, and inherited properties requiring extensive capital expenditure.
With 17.9% of listings reducing prices, investors who can offer rapid cash closings, waive inspection repair demands, and purchase properties in as-is condition can negotiate substantial discounts off original list prices. This dynamic is particularly prevalent in North County (Florissant, Hazelwood) and South City (Dutchtown, Carondelet, Gravois Park), where retail buyer demand is most sensitive to prevailing interest rates.
2. Multifamily Fundamentals and Rental Demand
The St. Louis rental market continues to provide stable baseline fundamentals. According to second-quarter 2026 data and regional multifamily updates, average apartment rent in St. Louis City reached $1,439 per month in July 2026, representing a 2.37% year-over-year increase. Occupancy rates across workforce housing corridors remain stable, anchored by the region's diverse employment base across healthcare (BJC HealthCare, Mercy, SSM Health), higher education (Washington University, Saint Louis University), and defense/manufacturing (Boeing, Emerson Electric).
Investors underwriting small multi-family properties (2–4 units) in neighborhoods like South Grand, Maplewood, and University City can achieve gross rent multipliers between 8 and 10, with cap rates ranging from 6.8% to 7.8% on stabilized assets. However, operational expenses—particularly property insurance, municipal occupancy re-inspections, and maintenance costs—require conservative modeling.
3. Micro-Market Underwriting and Cap Rate Discipline
Investors must account for localized underwriting variables across specific St. Louis submarkets:
-
Fix-and-Flip Execution:
Flippers targeting inner-ring suburbs or historic urban neighborhoods must budget for elevated material costs, specialized historic district permit requirements (such as in Soulard or Lafayette Square), and longer retail listing periods (30–60 days). Underwriting should incorporate at least a 10% contingency reserve for unforeseen structural or mechanical repairs.
-
Single-Family Rental (SFR) Portfolios:
Suburban rental acquisitions in St. Charles County and South St. Louis County command premium tenant quality, longer lease durations, and lower annual turnover, offsetting slightly compressed initial capitalization rates (6.2% to 6.8%). In contrast, North County rentals offer higher initial cash-on-cash returns (8.5% to 10.0%) but require more intensive property management and maintenance oversight.
-
Commercial and Mid-Size Multi-Family Cautions:
While top-line rents remain positive, effective rental growth has moderated from post-pandemic peaks. Underwriting should incorporate a 7%–9% structural vacancy and credit loss factor alongside realistic capital expenditure replacement reserves ($350–$500 per unit annually).
What to Watch in the St. Louis Market During September 2026
As the market transitions into post-Labor Day activity, several key indicators will dictate the trajectory of St. Louis real estate through the fourth quarter of 2026:
Post-Labor Day Listing Surge vs. Seasonal Deceleration
Historically, late August marks the tail end of the summer listing rush, followed by a brief post-Labor Day bump in September before activity slows into the late autumn and winter holidays. Real estate market participants should monitor whether new listing flow decelerates normally in mid-September or whether motivated sellers continue adding inventory to beat year-end deadlines. A sustained influx of new listings in September would push St. Louis County supply closer to 3.5 months, further expanding buyer negotiating power.
Mortgage Rate Movement Post-Jackson Hole and the September FOMC Meeting
Financial markets are closely tracking Federal Reserve policy signals heading into the September Federal Open Market Committee (FOMC) meeting. Any downward movement in benchmark yields that pulls 30-year fixed mortgage rates toward the 6.25%–6.50% range could unlock pent-up buyer demand, accelerating absorption before winter. Conversely, if rates stabilize above 6.75%, inventory accumulation will persist, and the frequency of price reductions will likely climb.
Absorption Rate Stability Across Price Segments
Keep a close watch on St. Louis County's months of supply metric, particularly in the $300,000–$500,000 mid-tier segment. If supply in this price band pushes toward 3.5 to 4.0 months, buyer leverage will broaden beyond aged inventory to include freshly listed properties, potentially flattening year-over-year median price growth heading into late 2026.
Price Reduction Frequency Thresholds
Tracking whether the share of listings with price cuts rises above 20% by late September will signal how quickly sellers are adapting to buyer resistance. A rising price reduction metric indicates that sellers are recognizing market realities and making mid-course corrections rather than allowing listings to go completely stale.
Actionable Checklists for the Week of August 31–September 4, 2026
To translate these market insights into direct operational decisions, here are specific action steps tailored for each market participant this week:
Action Steps for Sellers
-
Audit Your Asking Price Against Closed Comps: Base your list price strictly on properties that closed in the last 60 to 90 days within a 0.5-mile radius, not on active asking prices of neighboring homes that have not yet secured buyers.
-
Execute Strategic Price Adjustments Early: If your property has been listed for 21 or more days with fewer than 5 showings or no written offers, implement a 3% to 5% price reduction before your listing becomes categorized as stale.
-
Resolve Municipal Inspection Items in Advance: Order your St. Louis County municipal occupancy pre-inspection or City building inspection immediately so repair requirements do not jeopardize your closing timeline.
-
Evaluate As-Is Cash Alternatives: If repair estimates exceed your cash reserves or timeline, request a no-obligation cash offer from a reputable local home buyer to compare against net proceeds from a traditional listing.
Action Steps for Buyers
-
Secure Full Lender Underwriting: Upgrade your pre-qualification to a fully verified pre-approval with verified assets and income, enabling you to write strong, clean offers with short financing contingency windows.
-
Screen for 30+ Day Listings with Price Cuts: Identify properties that have logged price adjustments and have been on the market for over a month; these represent your highest-probability opportunities for seller-paid rate buydowns and closing credits.
-
Include Dedicated Inspection Contingencies: Never waive your right to professional building, radon, and sewer scope inspections. Use inspection findings constructively to negotiate closing credits rather than canceling contracts outright.
-
Stress-Test Your Monthly Housing Budget: Confirm that your total monthly housing expenditure (principal, interest, property taxes, insurance, and HOA fees) does not exceed 28% to 32% of your gross monthly household income at prevailing rates.
Action Steps for Real Estate Investors
-
Track Price-Per-Square-Foot Drops by Zip Code: Set up automated MLS and property record alerts for submarkets showing above-average inventory accumulation (such as 63031 in Florissant or 63116 in South City).
-
Review Rental Comps with Real-World Vacancy: Underwrite rental acquisitions assuming 8% vacancy and $1.10 to $1.35 per square foot rents for standard workforce housing units across St. Louis County.
-
Target Inherited and Off-Market Opportunities: Focus acquisition marketing on properties requiring substantial cosmetic or structural capital expenditure where traditional retail buyers cannot secure conventional financing.
-
Build Relationships with Local Portfolio Lenders: Partner with local St. Louis community banks and credit unions that offer competitive commercial portfolio loans, DSCR financing, and flexible renovation credit lines.
Key Takeaways and Conclusion
The late-summer 2026 St. Louis real estate data paints a definitive picture: active single-family inventory has expanded 15.2% to 3,563 homes, while median sale prices have climbed to $350,000 across the region and $320,000 in St. Louis County.
This is neither a runaway seller's market nor a collapsing buyer's market. It is a discerning, performance-driven real estate environment where success is determined entirely at the individual property level. Sellers who price with precision, address physical condition, and market aggressively continue to capture strong returns and fast sales. Buyers who understand neighborhood-level differences and target aged listings can secure concessions, price reductions, and terms that were virtually unattainable during the peak seller's market. Investors who maintain disciplined underwriting standards can find reliable acquisition opportunities across both suburban and urban submarkets.
By grounding your real estate decisions in verified hyper-local data rather than national generalizations, you can navigate the late 2026 St. Louis housing market with complete clarity and confidence. Whether buying, selling, or investing, recognizing the distinct realities of St. Louis City versus County, suburban corridors, and property-specific conditions is the ultimate key to achieving your housing and investment goals.
Ready to Buy or Sell in St. Louis? House Sold Easy Has You Covered!
Whether you're thinking about listing your home or exploring a cash offer, it's worth understanding all of your options before making a decision. The right choice depends on your timeline, your property's condition, and your goals. Contact House Sold Easy to discuss your situation and see what makes the most sense for you.Our St. Louis experts know every corner of this city and will make buying your dream home or selling your high-end property a breeze. Don’t miss out on the hottest market in the U.S.! Contact House Sold Easy today and let’s make your real estate goals happen!