St. Louis Real Estate Market Update: Inventory Rises
Aug 25, 2026
Written by House Sold Easy Team
For prospective homebuyers who spent the last several seasons navigating scarce listings, intense weekend open houses, and rapid escalation clauses, the housing climate in the Gateway City is reaching an important turning point. As late August 2026 unfolds, the data confirms a definitive transition: active inventory across the metropolitan area is increasing at a double-digit annual pace, listing prices are becoming more flexible, and the pressure of competing against a dozen blind offers on every single home has noticeably eased.
This does not mean the entire St. Louis region has suddenly flipped into an aggressive buyer’s market. Highly upgraded, turnkey homes in top-tier suburban school districts and historic core neighborhoods continue to command competitive offers. Instead, local real estate participants are experiencing a bifurcated, selective market in August 2026. Well-priced properties that are move-in ready and easy to show move quickly, while outdated homes, properties with deferred maintenance, or listings burdened with unrealistic asking prices linger on the market and accumulate price reductions.
For the week of August 24, 2026, the overarching market reality is clear: St. Louis buyers currently hold more negotiating power and broader choices than they have had in years, while sellers must navigate modern pricing discipline, careful staging, and realistic timeline expectations to succeed.
1. What’s Changing in the St. Louis Housing Market
The headline story shaping residential real estate across the region is the consistent expansion of housing supply. According to
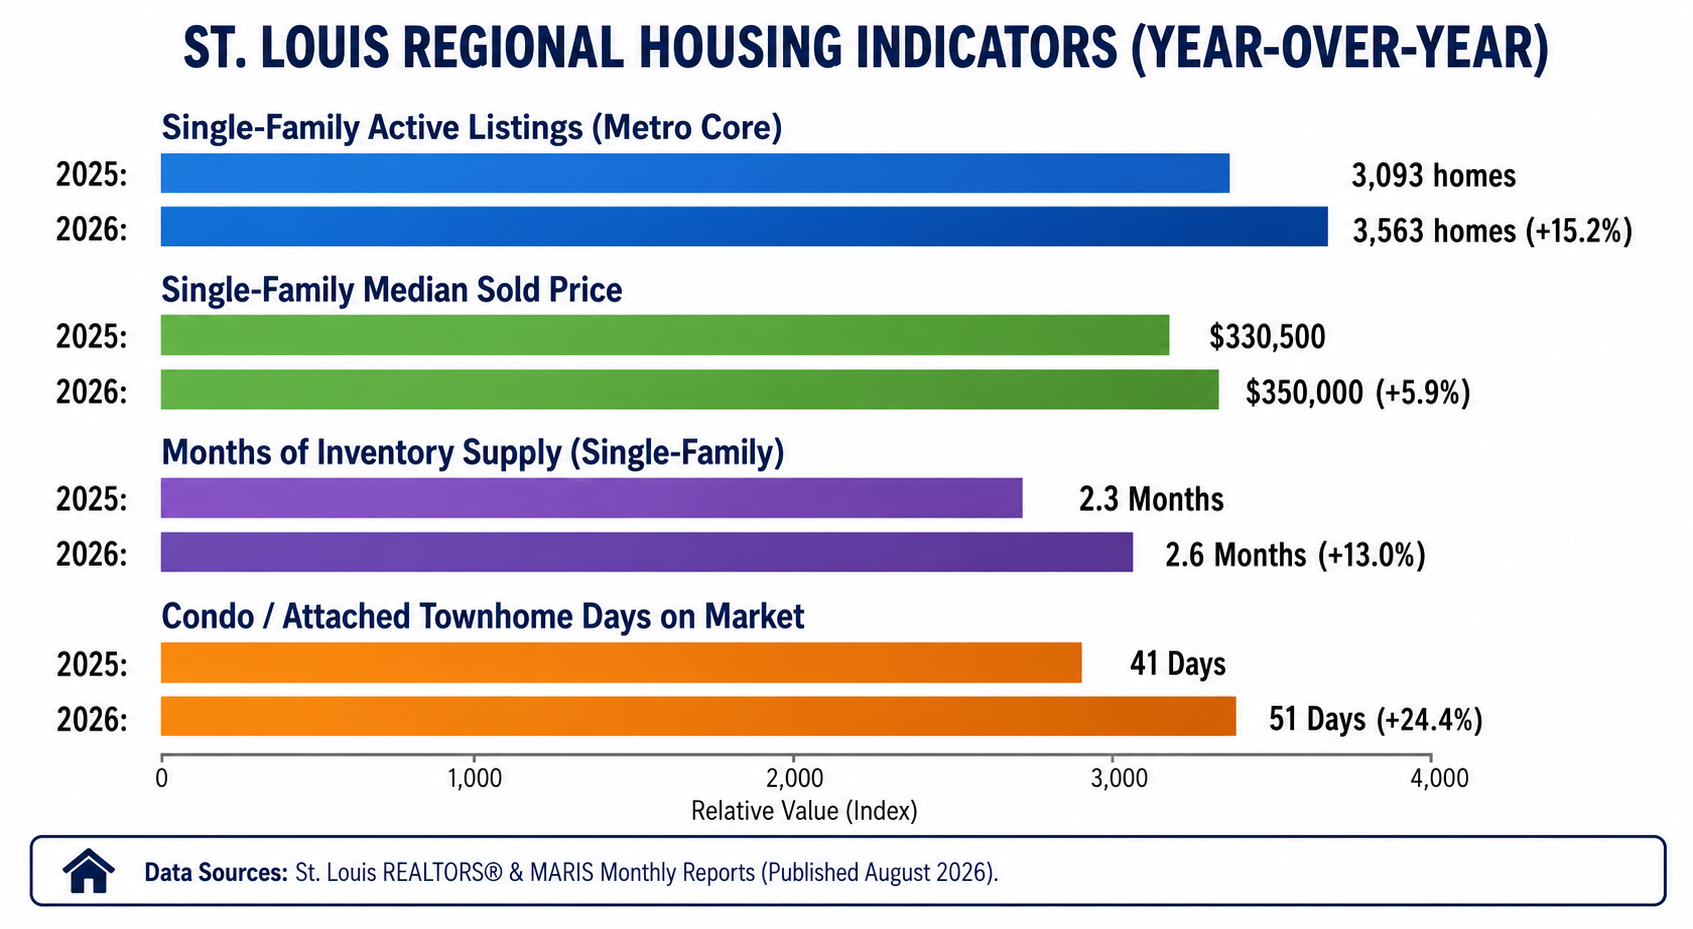
This supply expansion has raised single-family inventory to 2.6 months of supply across the metro core.
This inventory growth shifts the day-to-day dynamic of local real estate transactions in several tangible ways:
-
Broader Comparative Choices: Buyers are no longer forced to decide between one or two compromise properties on a single weekend. They can cross-compare floor plans, square footage, lot sizes, and municipal tax rates across multiple listings.
-
Return of Standard Contract Protections: Inspection resolution contingencies, appraisal gap limits, and traditional financing timelines are once again standard features of standard purchase contracts rather than points of immediate elimination.
-
Heightened Listing Competition: Sellers who previously enjoyed a captive audience must now compete actively for qualified buyers against comparable homes located just blocks away.
-
Severe Penalties for Overpricing: When buyers have five comparable homes to tour instead of one, properties priced above fair market value do not receive speculative offers; they simply receive zero showings.
2. Asking Prices vs. Sold Prices: Dissecting the Divergence
A defining characteristic of the August 2026 St. Louis market is the statistical divergence between seller asking prices and finalized closed sale prices. While the overall single-family median closed price rose 5.9% year-over-year to $350,000, active listing prices across several core submarkets have compressed.
For example, the
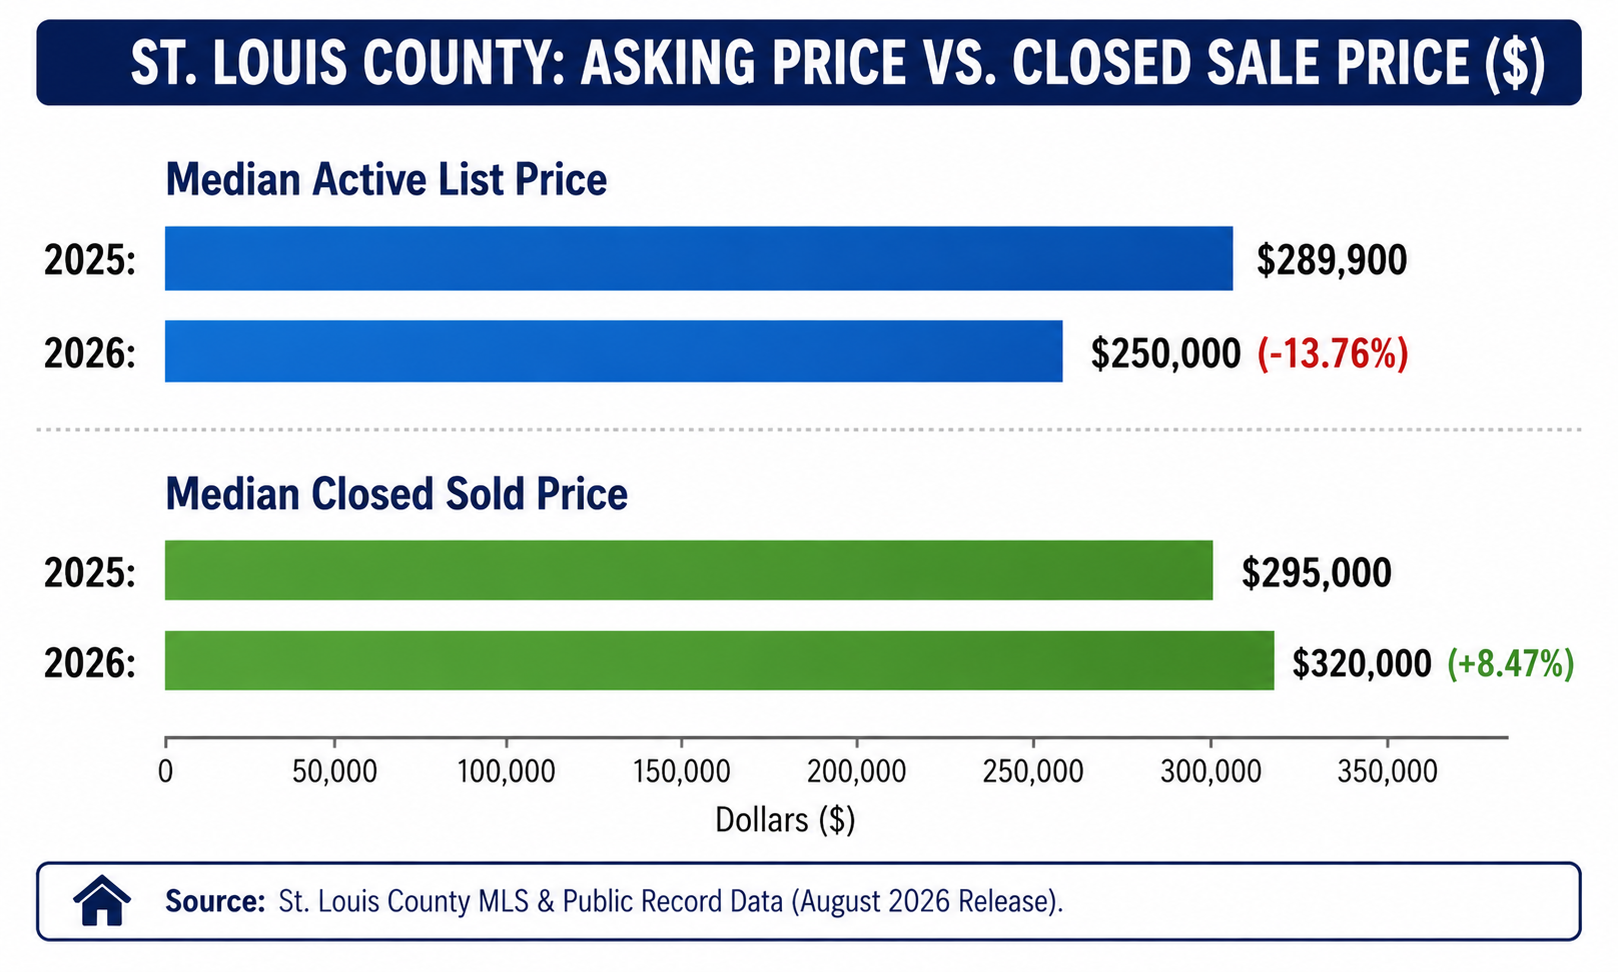
Why Do Asking Prices and Closed Prices Move in Opposite Directions?
This apparent paradox stems from two structural mechanisms in the marketplace:
-
Inventory Composition Shifts: More entry-level single-family homes, modest ranch properties, and homes needing cosmetic remodeling have entered active inventory throughout summer 2026. Sellers of these properties are launching at realistic, accessible price points to draw interest, pulling the active listing median downward.
-
Lagging Closed Sales Reflect Quality Premiums: Closed sale data tracks contracts ratified 30 to 60 days prior. During the spring and early summer, premium move-in-ready properties located in prime school districts (such as Lindbergh, Parkway, Ladue, and Kirkwood) frequently attracted multiple offers and closed at or above asking price, bolstering closed price medians.
Additionally, mid-August market tracking shows that 17.9% of all active MLS listings in Greater St. Louis have executed at least one formal price reduction. When asking prices soften while closed sale medians hold firm, the message to market participants is direct: underlying property values remain stable, but buyers refuse to overpay for unrenovated or mispriced inventory.
3. Hyper-Local Analysis: St. Louis Submarkets & Neighborhoods
Because metropolitan averages combine diverse communities, analyzing submarkets individually is essential for making informed real estate decisions.
St. Louis County Core: Clayton, Ladue, Kirkwood & Webster Groves
The central and inner-ring suburbs of St. Louis County remain the most resilient sector of the market. High educational ratings, walkable commercial districts, and established architectural character sustain steady buyer demand.
-
Kirkwood and Webster Groves: Move-in-ready historic two-story homes and renovated craftsman bungalows listed between $400,000 and $700,000 regularly go under contract in under 14 days. However, properties with functional obsolescence, awkward floor plans, or unaddressed foundation concerns are sitting for 30 to 45 days until sellers make $15,000 to $30,000 price corrections.
-
Clayton and Ladue: Luxury single-family inventory above $1,000,000 moves steadily for turnkey new construction and modernized estates. Older mid-century stock requires aggressive cosmetic discounting before luxury buyers commit capital.
Inner-Ring Value Corridors: Affton, Maplewood & Overland
For first-time homebuyers and value-oriented move-up buyers, mid-county and south-county border suburbs are serving as primary target zones.
-
Affton and Maplewood: Homes priced between $220,000 and $320,000 offer strong affordability relative to central corridor pricing.
-
Overland and St. Ann: These northwest county communities feature substantial inventory of brick ranches and starter homes below $200,000. Properties here show higher sensitivity to interest rate fluctuations, with days on market averaging 28 to 35 days.
North County: Florissant & Hazelwood
North St. Louis County offers some of the highest cash-flow potential and lowest acquisition costs in the metro area. In Florissant, active inventory has grown by over 18% year-over-year. Buyers have substantial negotiating leverage, with sellers frequently agreeing to pay 2% to 3% in buyer closing cost credits or funding temporary 2-1 mortgage rate buydowns.
St. Louis City: Historic Neighborhoods vs. Downtown Lofts
According to recent urban transaction tracking, the City of St. Louis maintains a median closed sale price between $259,000 and $265,000.
-
Tower Grove South, Shaw, and Soulard: Brick historic homes, updated duplexes, and multi-family fourplexes continue to see consistent demand driven by walkability, park access, and vibrant independent commercial districts. Fully renovated properties command $350,000 to $500,000+.
-
Central West End (CWE): High institutional employment from the Washington University Medical Campus and Barnes-Jewish Hospital maintains a solid floor for luxury single-family homes and historic condos.
-
Downtown St. Louis (63101 / 63103): The residential loft market continues to face longer absorption periods.
Redfin Downtown St. Louis market metrics
St. Charles County: O'Fallon, St. Peters & Wentzville
West of the Missouri River, St. Charles County remains a high-volume suburban market characterized by newer subdivisions, master-planned developments, and modern public infrastructure.
-
August 2026 MARIS/InfoSparks tracking -
In Wentzville and O'Fallon, national and regional homebuilders are competing directly with resale listings by offering mortgage rate buydown incentives (often buying 30-year rates down into the high 5% range for the initial years of the loan).
4. Comprehensive St. Louis Market Data Table
The table below outlines verified key performance metrics across the St. Louis metropolitan footprint as of late August 2026:
| Market Metric / Indicator | Prior Period (2025) | Current August 2026 Data | Metric Shift (YoY) | Primary Market Implication |
|---|---|---|---|---|
|
Single-Family Active Inventory |
3,093 homes |
3,563 homes |
+15.2% |
Buyers gain selection; less weekend urgency |
|
Single-Family Median Sale Price |
$330,500 |
$350,000 |
+5.9% |
Resilient home values; equity preservation |
|
Single-Family Months of Supply |
2.3 months |
2.6 months |
+13.0% |
Gradual movement toward balanced conditions |
|
Condo / Townhome Inventory |
760 units |
830 units |
+9.2% |
Expanding supply in attached housing sector |
|
Condo / Townhome Months of Supply |
3.1 months |
3.8 months |
+22.6% |
Attached sector approaching true buyer balance |
|
Condo / Townhome Days on Market |
41 days |
51 days |
+24.4% |
Extended marketing windows; negotiating leverage |
|
St. Louis County Median Sold Price |
$295,000 |
$320,000 |
+8.47% |
Suburban buying power remains robust |
|
St. Louis County Median List Price |
$289,900 |
$250,000 |
-13.76% |
Realistic list pricing by entry/mid-tier sellers |
|
Active Listings with Price Cuts |
~14.1% |
17.9% |
+3.8 pts |
Overpriced properties forced to adjust |
|
U.S. 30-Year Fixed Mortgage Rate |
6.58% |
6.65% |
+0.07 pts |
Higher borrowing costs continue to pressure affordability |
5. Strategic Playbook for St. Louis Homebuyers
For buyers operating in the late summer 2026 housing market, increased inventory provides practical advantages, but strategic execution remains crucial.
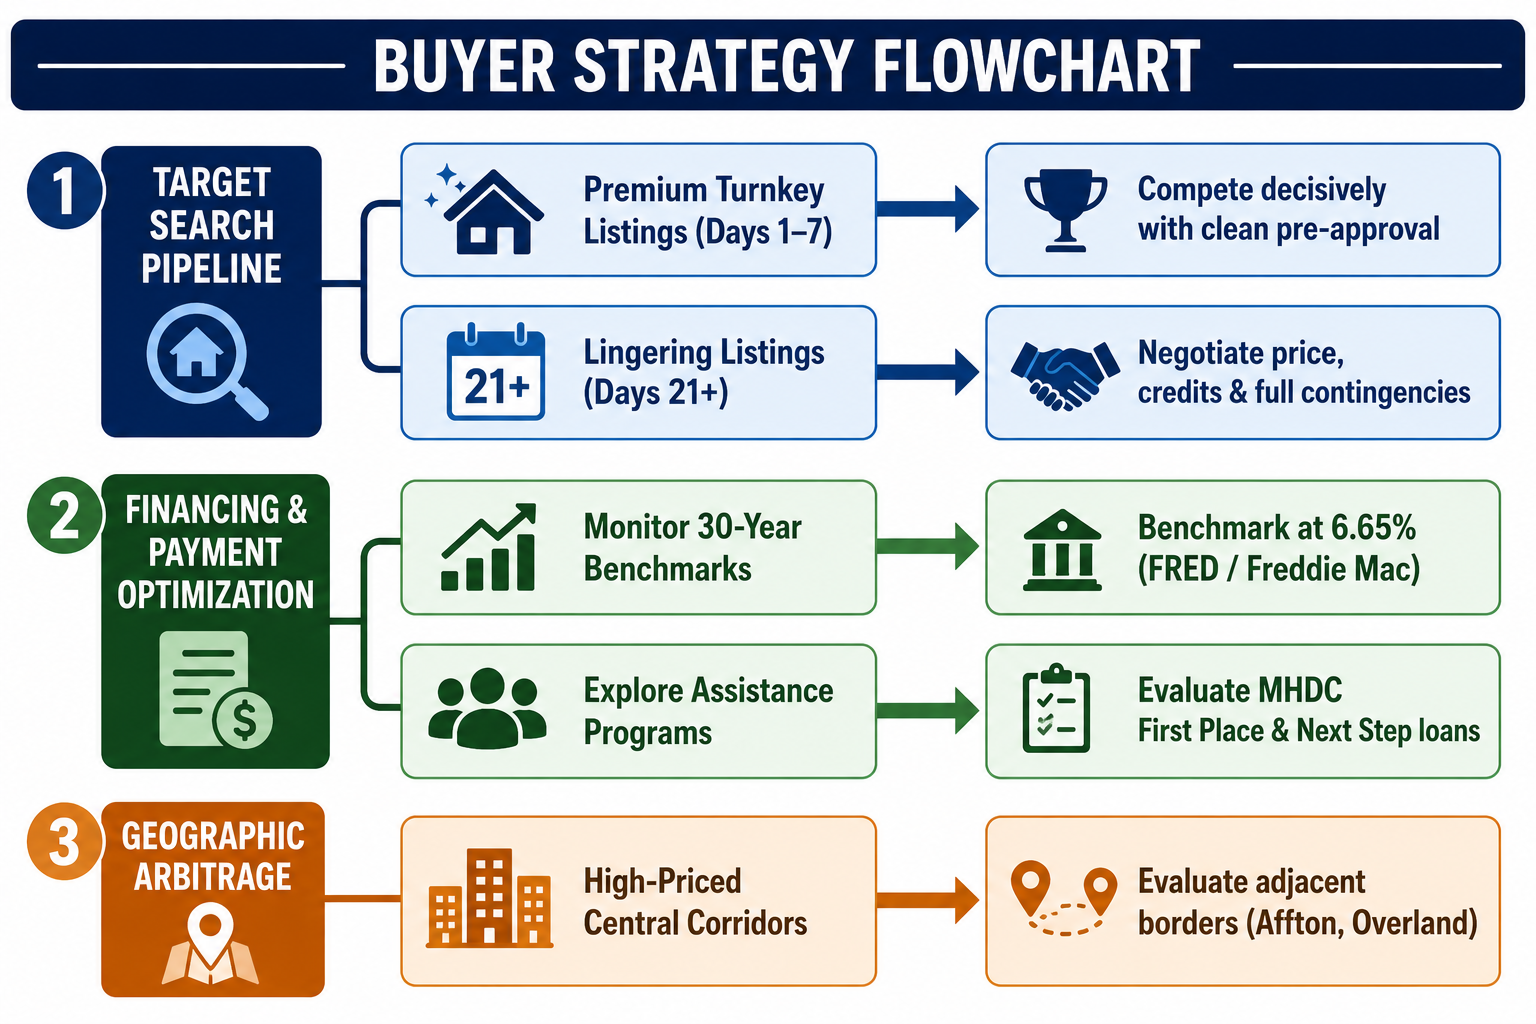
1. Separate "New to Market" from "High Value"
The first 7 to 10 days on market remain the peak window of visibility for any new listing. Turnkey properties in sought-after areas still attract immediate interest. However, buyers should systematically monitor listings that have been on the market for 21 to 45 days. Properties in this bracket often suffer not from structural defects, but from flawed initial pricing or mediocre listing photos. These homes represent prime opportunities to negotiate 3% to 6% below asking price, request seller-paid closing credits, or secure repair allowances.
2. Underwrite by Monthly Debt Service, Not Loan Maximums
According to the
-
On a $300,000 purchase with 10% down ($270,000 loan amount) at a 6.65% interest rate, principal and interest totals approximately $1,733 per month.
-
Adding St. Louis County real estate taxes, homeowners insurance, and municipal sewer/trash district assessments brings total monthly obligations to approximately $2,250–$2,450 per month.
-
Request a complete Loan Estimate from a local lender that models multiple rate scenarios, local property tax assessments by school district, and hazard insurance costs.
3. Leverage State and Local Financing Programs
Many St. Louis homebuyers overlook state-level down payment assistance. The Missouri Housing Development Commission (MHDC) offers the First Place and Next Step loan programs, which provide eligible buyers with fixed-rate mortgage financing alongside cash assistance of up to 4% of the total loan amount to cover down payments and closing costs.
6. Strategic Playbook for St. Louis Home Sellers
In an environment where active listings have expanded by 15.2%, sellers can no longer rely on unearned market momentum to achieve premium sale prices. Success requires precision in preparation, pricing, and timing.
1. Price Against Active Competitors, Not Past Neighborhood Highs
The most common mistake sellers make in late 2026 is pricing their home based solely on a neighbor’s record-setting sale from six months ago. Today’s buyers are comparing your listing against active alternatives available to tour this weekend. If your home is listed at $375,000 while two comparable properties down the street are active at $355,000, buyers will use your property as justification to purchase your neighbor's home. Conduct a rigorous comparative market analysis that evaluates active, pending, and expired listings alongside closed sales.
2. Maximize the Critical 14-Day Launch Window
A property generates over 60% of its total lifetime digital impressions within the first 14 days of hitting the MLS. To maximize this exposure:
-
Complete a Pre-Listing Inspection: Identify and resolve deferred mechanical, roof, plumbing, or electrical issues before listing.
-
Invest in Professional Media: High-dynamic-range photography, detailed 2D floor plans with room dimensions, and virtual tours are essential standards. With 17.9% of the market cutting prices, substandard mobile phone photos signal a distressed or poorly maintained property.
-
Streamline Showing Access: Utilize automated showing software and accommodate weekend viewing requests without restrictive advance notice hurdles.
3. Interpret Showing Feedback Objectively
Track showing activity systematically. If a listing receives 15 showings over two consecutive weekends with zero offer submissions, the market is communicating a pricing or condition disconnect. Rather than waiting 60 days to make an incremental 1% adjustment, execute a decisive 4% to 6% price correction to recapture active buyer interest before the listing becomes stale.
7. Strategic Playbook for Real Estate Investors
For residential real estate investors, private landlords, and capital allocators, August 2026 presents attractive buying opportunities alongside clear underwriting constraints.
1. Capitalize on the Condo and Townhouse Softening
With attached housing inventory rising to 3.8 months of supply and marketing times climbing to 51 days, condominium and townhome communities offer excellent entry points for buy-and-hold investors. Motivated individual sellers and developers looking to close out phases are receptive to price discounts, credit concessions, and portfolio package deals. Target units located near major employment hubs, including the Cortex Innovation Community, BJC Medical Center, and Clayton's financial district.
2. Evaluate Rental Demand vs. Acquisition Yields
Across the St. Louis metro, single-family rental demand remains healthy due to households delaying home purchases in the current interest rate environment. In working-class suburban submarkets such as Overland, Florissant, and South County, single-family rental properties acquired in the $160,000 to $220,000 range achieve gross yields of 7.5% to 9.0% when managed effectively.
3. Navigate Municipal Inspections and Occupancy Regulations
Investors acquiring distressed assets or rental properties must account for hyper-local municipal governance across St. Louis County's 88 distinct municipalities. Municipalities such as University City, Florissant, and Ferguson enforce strict exterior and interior municipal occupancy code inspections before tenant changes. Factor municipal compliance costs, licensing fees, and timeline buffers directly into your upfront acquisition underwriting.
8. Navigating St. Louis Real Estate by Municipal Jurisdiction
Operating effectively in the St. Louis real estate ecosystem requires understanding the regulatory and tax framework governing different local jurisdictions:
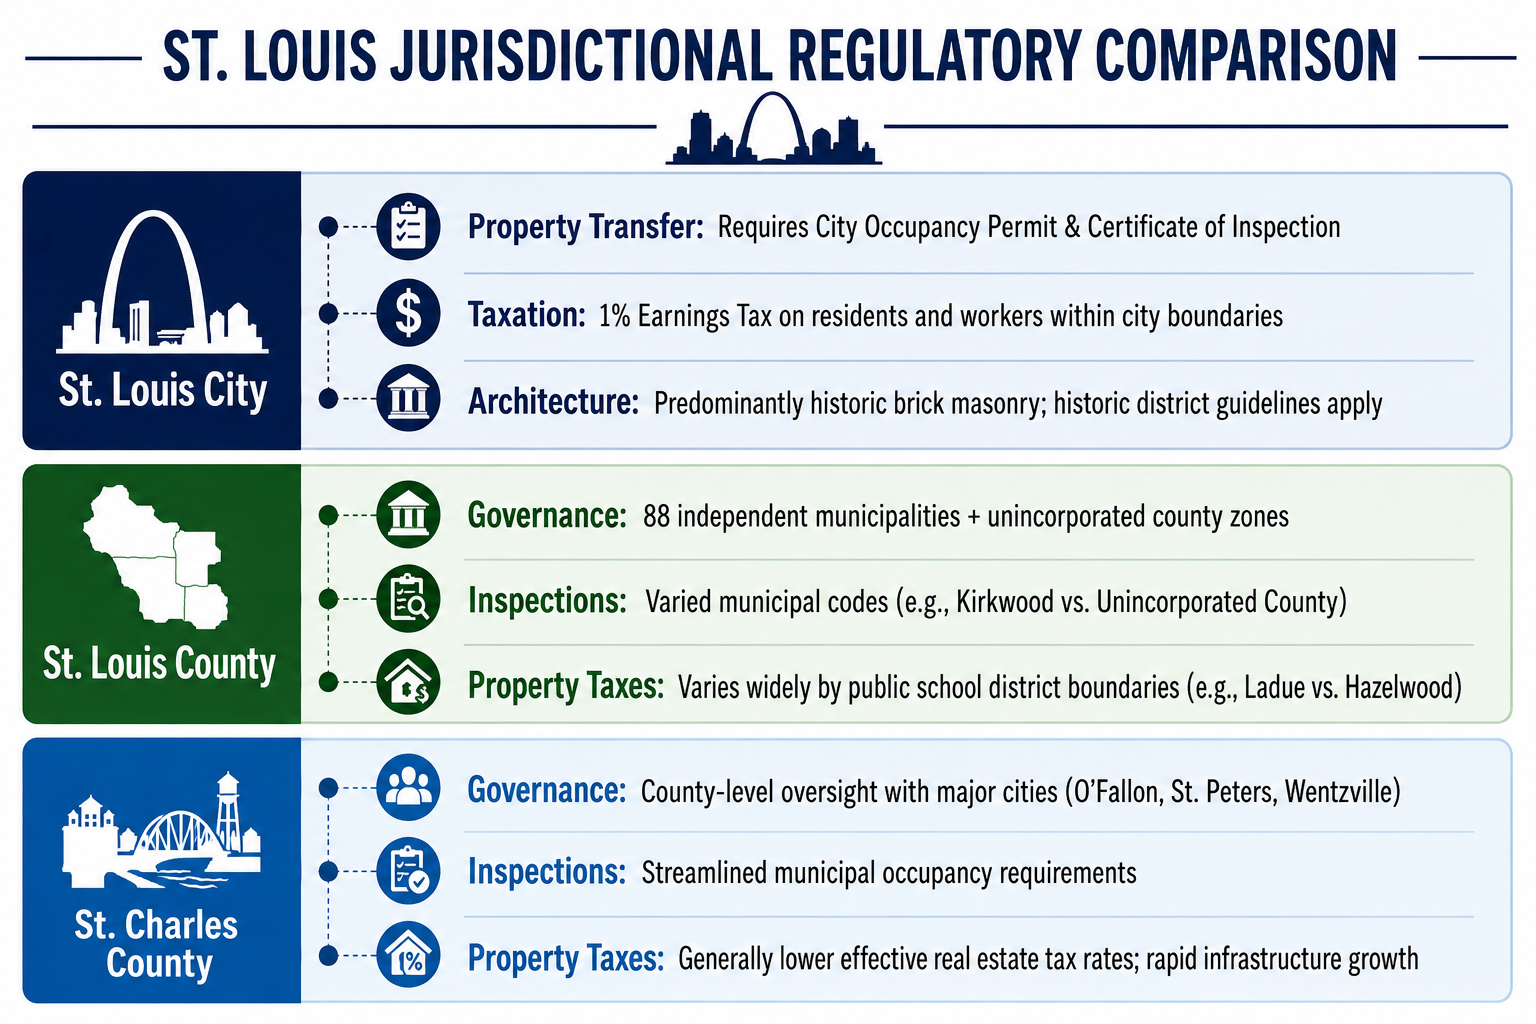
Understanding these distinctions ensures that buyers accurately calculate their all-in monthly payment, sellers avoid closing delays caused by municipal compliance re-inspections, and investors budget correctly for long-term operational costs.
Conclusion: Navigating the Gateway City's Next Phase
The St. Louis real estate market in late August 2026 is defined by balance, selectivity, and renewed opportunity. The double-digit expansion in active single-family listings to 3,563 homes and attached supply to 3.8 months has relieved the intense pressure that characterized previous buying cycles.
For buyers, the current market offers the breathing room needed to thoroughly inspect properties, secure balanced contract terms, and evaluate long-term affordability against prevailing mortgage benchmarks.
As the region moves toward the autumn market, success in St. Louis real estate relies on localized, block-by-block analysis. By tracking neighborhood inventory trends, monitoring submarket price behavior, and aligning financial strategies with current market realities, buyers, sellers, and investors can make confident, informed real estate moves throughout the remainder of 2026.
Ready to Buy or Sell in St. Louis? House Sold Easy Has You Covered!
Whether you're thinking about listing your home or exploring a cash offer, it's worth understanding all of your options before making a decision. The right choice depends on your timeline, your property's condition, and your goals. Contact House Sold Easy to discuss your situation and see what makes the most sense for you.Our St. Louis experts know every corner of this city and will make buying your dream home or selling your high-end property a breeze. Don’t miss out on the hottest market in the U.S.! Contact House Sold Easy today and let’s make your real estate goals happen!