Selling a St. Louis Home in 2026: Price It Right
Aug 27, 2026
Written by House Sold Easy Team
For years, home sellers across the St. Louis metropolitan area operated in an environment where severe inventory shortages masked minor tactical errors. If a property was listed five or ten percent above market value, steady buyer demand and rapid market velocity often caught up to the number within weeks.
In August 2026, that market dynamic has fundamentally changed.
According to the
The message from the data is straightforward: the St. Louis market will no longer rescue an overpriced listing.
While well-positioned, meticulously prepared homes continue to command strong purchase prices, buyers are no longer making frantic, unvetted concessions. Today’s buyers are payment-conscious, armed with growing inventory options, and willing to bypass properties where the asking price does not align with condition and location.
What’s Changing in the St. Louis Market
Navigating the 2026 real estate landscape requires understanding the economic forces shaping local buyer behavior. The market is not experiencing a crash; rather, it is undergoing an orderly recalibration toward balanced historical norms.
| CORE FORCES RESHAPING ST. LOUIS IN 2026 | |
|---|---|
|
Higher Inventory |
Active listings up 10% to 14.5% across the MSA; supply levels expanded from ~1.5 to 3.16 months. |
|
Elevated Rates |
30-year fixed mortgages averaging ~6.65% to 6.72%, keeping monthly debt service top-of-mind. |
|
Selective Buyers |
Greater choice allows buyers to demand repairs, appraisal equity, and move-in-ready presentation. |
|
Price Reductions |
17.9% of active properties have taken cuts, signaling the risk of testing aspirational numbers. |
1. The Inventory Expansion
For nearly half a decade, the St. Louis MSA suffered from chronic supply constraints, frequently hovering between 1.2 and 1.8 months of inventory.
While a balanced market is traditionally defined as 4 to 6 months of inventory, moving from under 2 months to over 3 months doubles the competing inventory pool. Buyers touring homes in suburban corridors like Kirkwood, Ballwin, or Chesterfield now regularly compare three or four viable properties within a single weekend tour instead of scrambling to offer on the only available house.
2. Financing Costs and Purchasing Power
According to the
At a 6.65% interest rate, the principal-and-interest payment on a $300,000 loan balance is approximately $1,926 per month—excluding property taxes, municipal sewer district assessments, and hazard insurance. When combined with St. Louis County real estate assessments and rising insurance premiums, monthly carrying costs require buyers to budget carefully. Consequently, buyers are factoring repair costs, roof replacements, and mechanical updates directly into their purchase offers.
3. Price Reductions and Market Velocity
The mid-August 2026 regional market data highlighted in the
Furthermore, cumulative days on market have shifted. In July 2026, the median days on market across St. Louis County stood at 49 days, up from 42 days in July 2025 and substantially higher than the 11- to 18-day turnarounds observed during peak pandemic conditions.
Visual 1: St. Louis Market Trend Comparison
The following visual illustrates key shifts between July 2025 and July 2026 in St. Louis County, highlighting the divergence between asking prices and closed contract values:
Horizontal comparison of housing-market metrics. Each metric is indexed to its 2025 value (2025 = 100) because the measures use different units.
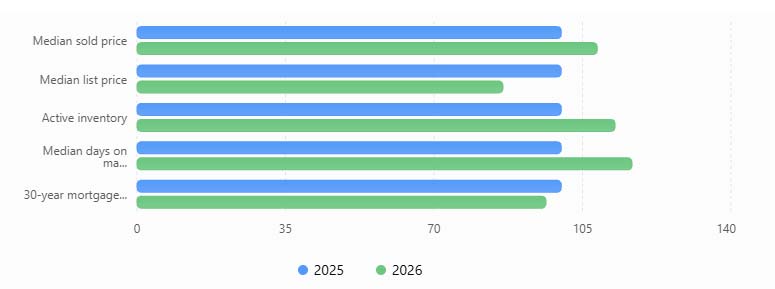
Sources provided: MORE, REALTORS® August 2026 Update | Freddie Mac PMMS | St. Louis MLS Data
List Price and Sold Price Tell Different Stories
A central source of confusion for St. Louis homeowners in 2026 is the statistical divergence between median listing prices and median closed transaction prices.
In the
WHY ASKING PRICES AND SOLD PRICES DIVERGE IN 2026
01COMPOSITIONAL SHIFT IN ACTIVE INVENTORY Turnkey, premium homes in desirable school districts sell rapidly, exiting the active listing pool quickly. The remaining active inventory consists disproportionately of smaller properties or homes needing work. |
02CONSERVATIVE LAUNCH STRATEGIES Professional listing agents are intentionally setting sharper introductory prices to stimulate multi-party showings and avoid listing stagnation. |
03BUYER FLIGHT TO QUALITY Buyers are paying top dollar for fully renovated, move-in-ready houses, driving up closed sale medians while rejecting outdated inventory. |
When sellers see an 8.47% rise in median closed prices, they may assume every property in their ZIP code has gained 8% to 10% in value regardless of condition.
For an individual seller, broad county-level averages are insufficient. Pricing strategy must be grounded in an analysis of the specific active, pending, and sold properties that a buyer will evaluate when choosing between your home and direct local alternatives.
Hyper-Local Submarket Dynamics Across St. Louis
Real estate in the St. Louis metropolitan area is intensely localized. School district boundaries, municipal building codes, architectural styles, and neighborhood reputations create distinct micro-climates across St. Louis County, St. Louis City, and St. Charles County.
|
ST. LOUIS SUBMARKET BREAKDOWN |
|||
|---|---|---|---|
|
Submarket Corridor |
Typical Price Tier |
Inventory Trend |
Buyer Profile |
|
Central County (Kirkwood, Webster) |
$350,000 – $650k+ |
Tight to Steady (2.1 – 2.8 mos) |
Move-up families, premium buyers |
|
West County (Clayton, Town & C.) |
$450,000 – $900k+ |
Moderate Growth (3.0 – 4.2 mos) |
Executive buyers, top schools |
|
St. Louis City Core (Tower Grove, CWE) |
$220,000 – $450k |
Mixed by Pocket (3.2 – 4.5 mos) |
Urban lifestyle, historic homes |
|
South County (Affton, Mehlville) |
$250,000 – $380k |
Steady Rise (2.4 – 3.2 mos) |
Starter families, value seekers |
|
North County (Florissant, Hazelwood) |
$160,000 – $260k |
Rising Supply (3.5 – 5.0 mos) |
First-time buyers & FHA borrowers |
|
St. Charles County (O'Fallon, Wentzville) |
$320,000 – $480k |
Builder Impact (2.0 – 2.9 mos) |
Suburban space, newer builds |
1. Central County: Kirkwood, Webster Groves, and Clayton
In established inner-ring suburbs like Kirkwood and Webster Groves, architectural charm and top-ranked public school systems maintain steady buyer interest. Turnkey historic bungalows, center-hall colonials, and updated mid-century homes regularly see strong showing traffic within 72 hours of listing.
However, price sensitivity has become prominent even in these competitive areas. In 2021–2022, a 1940s home with an unrenovated kitchen and aging galvanized plumbing would routinely receive multiple offers over asking price. In August 2026, buyers calculating high mortgage payments will deduct estimated renovation costs dollar-for-dollar. In premium areas like Clayton, executive buyers expect flawless staging, high-end mechanicals, and modern structural layouts before paying top-tier prices.
2. St. Louis City: Tower Grove, Central West End, and Soulard
As documented in the
-
Tower Grove South & Shaw: Historic brick single-family homes and converted multi-family homes near Tower Grove Park see strong demand from buyers prioritizing walkability and architectural character. Upgrades to tuckpointing, roof condition, and electrical panels (transitioning away from legacy knob-and-tube wiring) are essential to prevent transactions from stalling during inspection.
-
Central West End: High-density condominiums and historic mansions face varied buyer absorption. Turnkey brownstones and updated condos move steadily, while attached units with high HOA fees or deferred maintenance sit longer on the market.
-
Soulard & Benton Park: Historic preservation requirements and municipal building codes play a direct role in buyer assessments. Historic tax credits and completed structural updates add measurable value, while unrenovated brick row houses require realistic initial pricing.
3. St. Charles County: O'Fallon, St. Peters, and Wentzville
According to recent regional housing statistics published by
However, resale sellers in O'Fallon and Wentzville face direct competition from regional homebuilders. National and regional builders often offer financial concessions—such as below-market 5.25% fixed promotional interest rates or closing cost packages—which resale sellers must factor into their pricing and concession strategies.
4. North and South County: Florissant, Hazelwood, Affton, and Mehlville
-
North County (Florissant, Hazelwood): These submarkets serve as essential starter-home corridors. Buyers here frequently rely on FHA, VA, or Missouri Housing Development Commission (MHDC) first-time homebuyer financing programs. Because these loan products require strict property condition standards (FHA guidelines for peeling paint, handrails, roof integrity, and furnace safety), pre-listing repairs and realistic list pricing are crucial to avoid appraisal roadblocks.
-
South County (Affton, Mehlville, Oakville): Characterized by sturdy all-brick ranches and split-level homes built during the 1960s through 1980s. Turnkey ranches with finished basements attract solid competition, whereas homes with original cosmetic finishes require appropriate pricing adjustments to account for modernization costs.
Visual 2: St. Louis County Verified Market Indicators
The following table synthesizes data from the
| Market Indicator | July 2025 Benchmark | July 2026 Recorded Data | Year-over-Year Shift | Market Impact & Strategic Meaning |
|---|---|---|---|---|
|
Median Sold Price |
$295,000 |
$320,000 |
+8.47% |
Closed sale values remain |
|
Median List Price |
$289,900 |
$250,000 |
-13.76% |
Active inventory reflects |
|
Closed Transactions |
1,330 Units |
1,334 Units |
+0.30% |
Buyer demand remains stable |
|
Active Inventory |
~3,750 Units |
4,225 Units |
+12.67% |
Buyers have more choices, |
|
Months of Supply |
~2.60 Months |
3.16 Months |
+0.56 Months |
Shifts leverage gradually |
|
Median Days on Market |
42 Days |
49 Days |
+7 Days |
Marketing timelines have |
|
30-Yr Fixed Rate |
~6.90% |
6.65% (Aug 20) |
-0.25% |
Weekly average rate from |
|
Price Reduced Share |
16.8% |
17.9% (Mid-Aug) |
+1.10% pts |
— |
The First-Week Strategy: Launching at the Right Price
In real estate, a listing receives its highest organic visibility during the first 7 to 14 days on the Multiple Listing Service (MLS). Major portals—including Zillow, Realtor.com, and Redfin—deliver automated alerts to prospective buyers and real estate agents when a new property enters the market.
|
THE LISTING LIFE CYCLE: CRITICAL FIRST 30 DAYS |
||
|---|---|---|
DAY 1–7THE GOLDEN LAUNCH WINDOW
IF PRICED CORRECTLY: IF OVERPRICED: |
DAY 8–21THE BUYER SCRUTINY STAGE
|
DAY 22–30+THE STALE LISTING ZONE
|
Developing an Accurate Comparative Market Analysis (CMA)
An effective pricing strategy requires a comparative market analysis that reflects current conditions:
-
Focus on Recent Sold Comps (Past 60 to 90 Days): Real estate data from early 2024 or 2025 is no longer reflective of current borrowing costs and supply conditions. CMAs must prioritize recent closed sales within your immediate school district, municipality, or neighborhood pocket.
-
Analyze Active and Under-Contract Listings: Closed comps show what buyers paid in the past; active listings show your direct, live competition today. If three comparable homes are currently listed at $340,000 with updated basements and two-car garages, pricing an unrenovated property at $355,000 will simply help the competing properties sell first.
-
Account for Architectural Style and Usable Square Footage: In St. Louis submarkets with older housing stock (e.g., South City, Kirkwood, Florissant), a 1,400-square-foot brick ranch with an open floor plan and finished basement lives differently than a 1,400-square-foot historic two-story with steep staircases and shared upstairs baths. Adjustments must account for functional utility, lot topography, garage space, and foundation stability.
Preparing the Property Before Publication
A common mistake in a shifting market is publishing a listing before the home is fully prepared, intending to complete touch-ups during active showings. In 2026, buyers form immediate impressions through online high-resolution photography and virtual floor plans. If a listing presents poorly online, buyers will swipe to the next option without booking a tour.
| PRE-LISTING PREPARATION PROTOCOL | ||
|---|---|---|
PHASE 1MECHANICAL & STRUCTURAL INTEGRITY
|
PHASE 2COSMETIC & VISUAL OPTIMIZATION
|
PHASE 3STAGING & MEDIA PRODUCTION
|
Navigating St. Louis Municipal Occupancy Inspections
A unique element of selling real estate in the St. Louis metropolitan area is the prevalence of municipal building and occupancy code requirements. Dozens of separate municipalities across St. Louis County (e.g., Kirkwood, University City, Florissant, Ferguson, Maryland Heights) require municipal pre-sale inspections before ownership can transfer.
-
Schedule Early: Order municipal inspections two to three weeks before listing.
-
Complete Required Repairs: Typical municipal requirements include GFCI outlets near water sources, functional handrails along stairs, smoke and carbon monoxide detectors on every level, water heater relief valves, and clear sidewalk tripping hazards.
-
Remove Uncertainty: Having an approved municipal inspection report in hand gives buyers confidence and eliminates closing delays.
Showing Availability and Accessibility
Making a property easy to show is essential to maximizing buyer engagement. In August 2026, buyers often tour four to six properties during a single afternoon scheduling window.
-
The Friction Problem: If a listing requires a strict 24-hour advance notice, limits showings to small time windows, or requires the listing agent to be physically present for every tour, prospective buyers on tight schedules may drop the home from their itinerary.
-
Managing Pets and Remote Work: Make arrangements for pets during showing hours, and vacate the property during scheduled appointments. Buyers tour more thoroughly, discuss layout possibilities openly, and spend more time evaluating the space when the owner is not present.
-
Presentation Standards: Ensure the home is well-lit (open blinds, turn on lamps), clean, and smelling fresh for every showing.
Price Reductions: Strategy vs. Hesitation
In an environment where roughly 17.9% of active St. Louis listings undergo price adjustments, reducing an asking price is sometimes necessary.
| PRICE REDUCTION DECISION MATRIX | ||
|---|---|---|
|
14-Day Showing Velocity |
Showing Feedback |
Recommended Action |
|
0 to 4 Showings Few Online Views |
Low interest, few saves or inquiries |
Major Price Adjustment (4% to 7% reduction) |
|
10 to 18 Showings 0 Offers Submitted |
“Nice house, but feels slightly overpriced” |
Moderate Price Adjustment (2% to 4% reduction) |
|
Multiple Showings Repeated Objections |
Specific objections on aging roof/HVAC unit |
Seller Credit or Targeted Pre-Closing Allowance |
Common Price Adjustment Mistakes
-
Making Incremental, Micro-Reductions: Lowering a list price by $1,000 or $2,000 on a $350,000 home does not reset automated buyer search filters. Buyers search in round brackets (e.g., $300,000 to $325,000, or $325,000 to $350,000). Moving a price from $352,000 to $349,900 moves the listing into a lower search bracket, exposing it to an entirely fresh pool of prospective purchasers.
-
Delaying the Adjustment: Waiting 45 or 60 days before making a first price adjustment allows the listing to accumulate market fatigue. In today's market, if a property receives steady showings during the first 14 days without generating a single second-look or written offer, the market is signaling that the price is out of alignment with condition.
Seller Credits vs. Price Reductions: Structuring Concessions
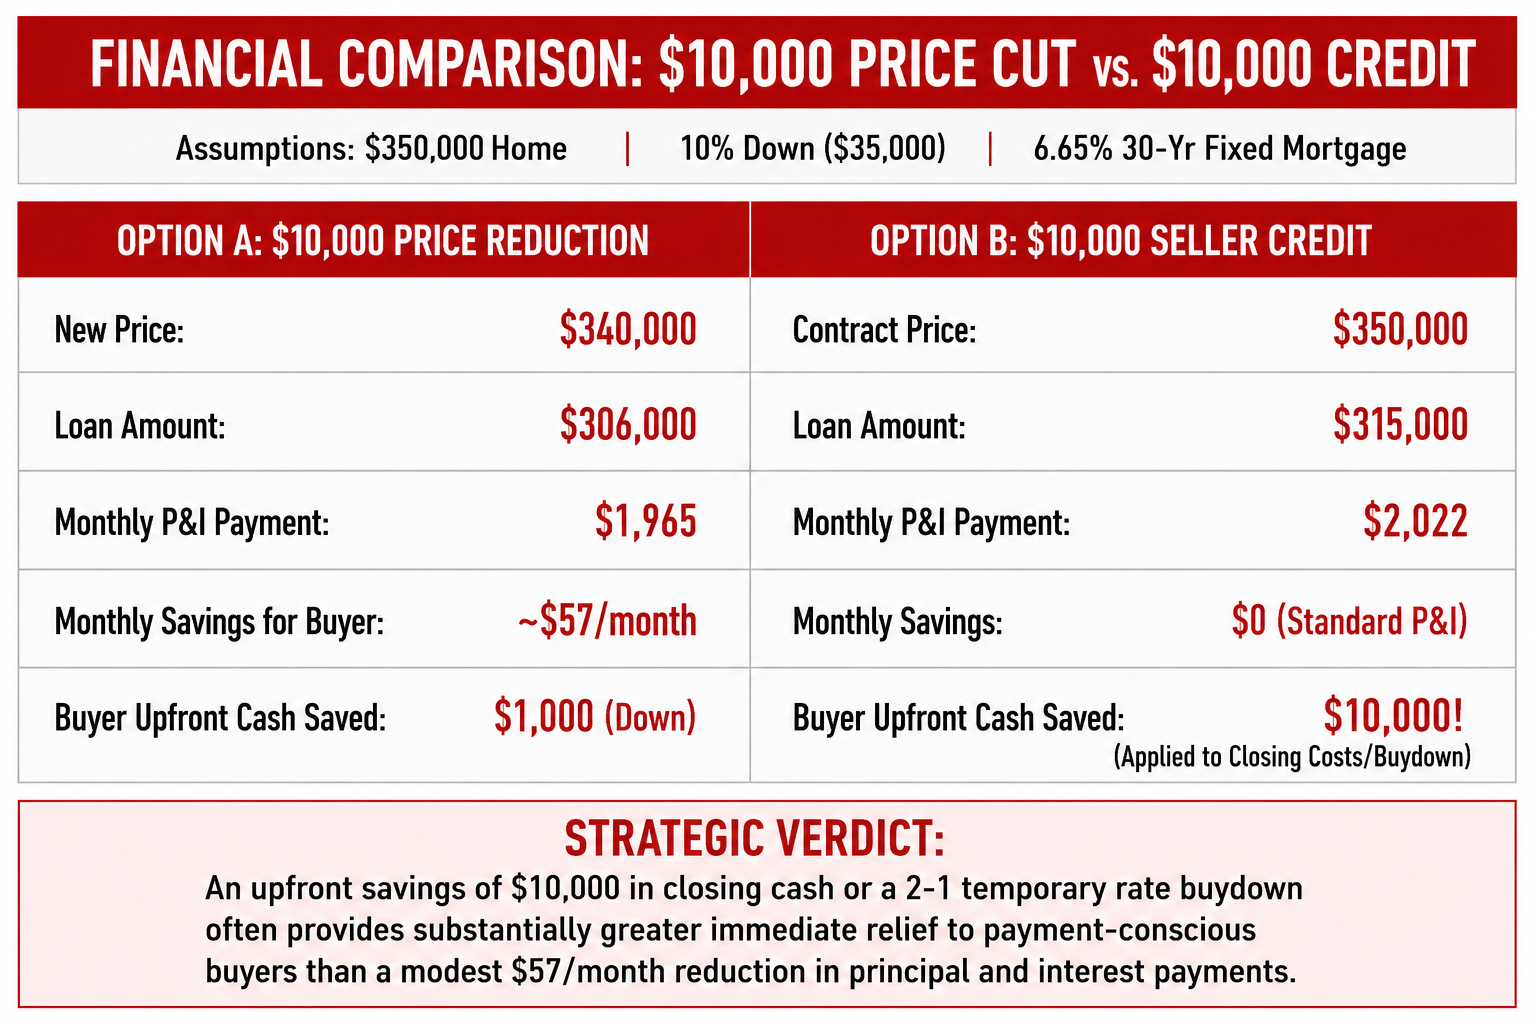
With prevailing mortgage interest rates at 6.65% to 6.72%, many prospective buyers face financing challenges related to down payments and closing costs.
|
COMPARING CONCESSION STRATEGIES |
|||
|---|---|---|---|
| Concession Strategy | Operational Mechanism | Key Benefit to Buyer | Limitation / Consideration |
|
Direct Price Reduction |
Adjusts asking price on MLS and contract |
Lowers total loan balance and property tax assessment base |
Has a minor effect on monthly debt service (~$5.70/mo per $1,000 reduced) |
|
Closing Cost Credit |
Seller contributes lump sum toward closing fees |
Directly reduces buyer's out-of-pocket cash requirements at settlement |
Subject to loan program caps (typically 3% to 6% of purchase price) |
|
Temporary 2-1 Rate Buydown |
Seller funds escrow to lower buyer rate by 2% in Year 1 and 1% in Year 2 |
Significantly reduces monthly payment during the first two years of ownership |
Requires lender-approved structure; home must appraise at contract price |
|
Repair Credit in Lieu of Work |
Cash credit provided at closing to settle inspection items |
Buyer selects their own contractors; avoids pre-closing delays |
Must be approved by buyer's underwriter as an allowable closing credit |
Important Note: Concessions are not a cure for substantial overpricing. If a property is overpriced by $30,000, offering a $5,000 seller credit will rarely convince a hesitant buyer to write an offer.
Five Common Mistakes St. Louis Sellers Make in 2026
Mistake 1: Relying Blindly on Automated Online Valuation Models (AVMs)
Automated valuation algorithms calculate figures by aggregating broad ZIP code data. They cannot evaluate whether a home backs up to a busy multi-lane arterial road, sits directly within a sought-after elementary school attendance zone, has modern tuckpointing on historic brick, or features an updated finished basement. Setting a list price based solely on an automated online estimate often results in misalignment with local market realities.
Mistake 2: Overvaluing Routine Capital Maintenance
Replacing a 20-year-old architectural shingle roof, installing a new 50-gallon water heater, or repairing sewer lateral lines are necessary maintenance investments that preserve property integrity. However, buyers view these items as baseline structural requirements rather than luxury enhancements. Spending $12,000 on a new roof rarely increases a home's market value by $12,000 above comparable properties that already possess functional, insurable roofs.
Mistake 3: Dismissing Inspection Objections on Older Homes
With a significant portion of St. Louis housing stock built prior to 1960, older brick homes, vintage sewer lines, and ungrounded electrical systems are common across South City, Maplewood, University City, and North County. Dismissing buyer inspection concerns as minor issues can lead to canceled contracts. In 2026, buyers with higher monthly payments are more cautious about taking on immediate post-closing repair expenses. Sellers should gather documentation for past mechanical upgrades, service records, and warranties to share upfront with potential buyers.
Mistake 4: Treating Consistent Showing Feedback as Irrelevant
When multiple independent buyer agents provide similar feedback—such as noting a dark lower level, pet odors, or an asking price out of sync with nearby comps—that feedback represents actionable market intelligence. Ignoring consistent responses often leads to extended days on market.
Mistake 5: Holding Out for an Unrealistic Cash Offer
During the 2021–2022 market peak, sight-unseen cash buyers waiving building inspections and appraisal contingencies were relatively common. In August 2026, the vast majority of St. Louis transactions involve conventional, FHA, or VA financing with standard appraisal and inspection contingencies.
|
ACTIONABLE 2026 MARKET TAKEAWAYS |
||
|---|---|---|
HOME SELLERS
|
HOME BUYERS
|
PROPERTY INVESTORS
|
For St. Louis Home Sellers
-
Price Realistically From Day One: Base your initial asking price on current active competitors and closed comps from the last 60 to 90 days.
-
Eliminate Deferred Maintenance: Complete visible repairs, service major HVAC equipment, and secure municipal occupancy inspections prior to listing.
-
Respond to Early Data: If showing activity is low during the first two weeks, assess whether an adjusted price, improved staging, or targeted seller concessions are needed to regain momentum.
For St. Louis Home Buyers
-
Take Advantage of Selection: With active inventory up 10% to 14.5% and homes spending a median of 49 days on market, you have more time to tour properties and complete thorough inspections.
-
Negotiate Closing Concessions: When making an offer on a home that has been active for more than 30 days, explore requesting seller contributions toward closing costs or temporary interest rate buydowns.
-
Maintain Loan Pre-Approval Readiness: Desirable, turnkey homes in prime locations still move quickly. Keep your financial documentation organized so you can act decisively when the right opportunity appears.
For Real Estate Investors
-
Evaluate Yields Against Financing Costs: With median sale prices holding at $320,000 in St. Louis County, verify that rental yields support debt service at prevailing 6.65% to 6.72% interest rates.
-
Identify Value-Add Opportunities: Properties with extended days on market due to dated finishes or cosmetic needs often offer negotiation room for strategic renovations.
-
Understand Local Rental Regulations: Municipalities across St. Louis County enforce specific rental licensing, occupancy limits, and tenant-turnover inspection codes that should be factored into operating budgets.
The Seller’s 10-Day Launch Checklist
To maximize market exposure and position a home effectively from day one, follow this structured 10-day launch schedule:
|
THE 10-DAY LISTING LAUNCH SCHEDULE |
|---|
| DAYS -10 TO -4: PRE-LISTING PREPARATION & CODE COMPLIANCE |
| DAYS -3 TO -1: MEDIA ASSETS & MLS INTEGRATION |
| DAY 0: LAUNCH DAY — WEDNESDAY / THURSDAY |
| DAYS 1 TO 4: THE FIRST WEEKEND — OPEN HOUSE & PRIVATE SHOWINGS |
| DAYS 5 TO 10: FEEDBACK ASSESSMENT & OFFER EVALUATION |
Ready to Buy or Sell in St. Louis? House Sold Easy Has You Covered!
Whether you're thinking about listing your home or exploring a cash offer, it's worth understanding all of your options before making a decision. The right choice depends on your timeline, your property's condition, and your goals. Contact House Sold Easy to discuss your situation and see what makes the most sense for you.Our St. Louis experts know every corner of this city and will make buying your dream home or selling your high-end property a breeze. Don’t miss out on the hottest market in the U.S.! Contact House Sold Easy today and let’s make your real estate goals happen!