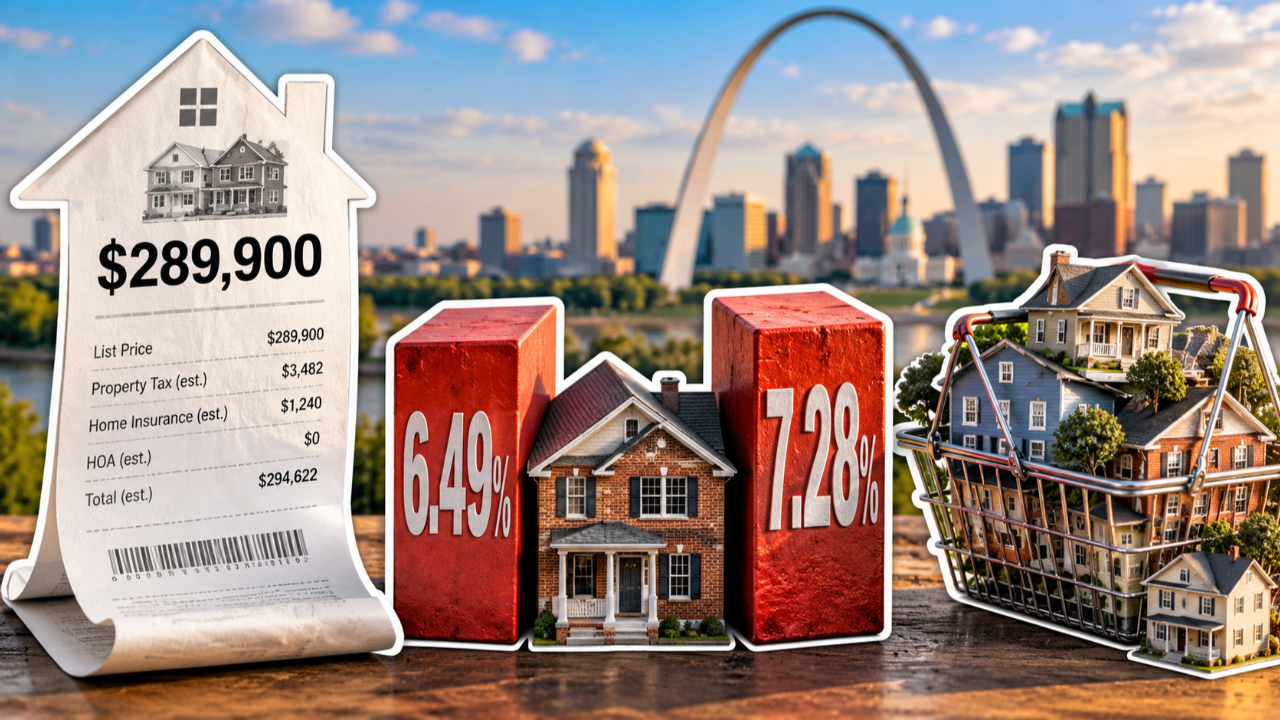
Buying a Home in St. Louis When Rates Are 6.65%
Aug 26, 2026
Written by House Sold Easy Team
The conventional wisdom in residential real estate often treats purchase price as the primary metric of affordability. When house-hunting across the Gateway City, listing prices dominate yard signs, MLS alerts, and weekend conversations. Yet for anyone actively touring properties across the St. Louis metropolitan area in late August 2026, the topline sticker price tells only a fraction of the story. The monthly carrying cost—and what that payment buys in structural condition, school districts, municipal services, insurance underwriting, and long-term liquidity—is what truly dictates whether a home purchase is a sustainable financial success.
According to weekly benchmark data compiled by the Federal Reserve Bank of St. Louis, the
Simultaneously, the supply side of the St. Louis regional market is undergoing a meaningful transformation. Metro-wide inventory has steadily expanded throughout the summer, with active listings climbing
For prospective St. Louis home buyers, this specific market intersection—mortgage rates hovering near 6.65% paired with a measurable expansion in available housing stock—creates a fundamentally different dynamic than the frenzied bidding wars of recent years. Navigating today’s market demands looking past headline list prices, analyzing total carrying costs across distinct municipalities, and leveraging increased inventory to negotiate concessions, price adjustments, and inspection repairs rather than stretching cash reserves to the breaking point.
1. What’s Changing in the St. Louis Market
The St. Louis housing market in late August 2026 has entered a constructive phase of recalibration. Over the past several years, severe inventory scarcity forced buyers to make rapid, high-risk decisions: bidding tens of thousands over asking price within hours of a listing going live, waiving critical structural inspections, and accepting properties with extensive deferred maintenance simply to secure a roof over their heads.
Today, the script has flipped. While pristine, turnkey properties in high-demand central corridors continue to move briskly, the broader market has gained breathing room.
Inventory Expansion Across Submarkets
The most significant development this summer is the steady accumulation of active inventory. Across the regional Core-Based Statistical Area (CBSA), active single-family listings have risen to
Moderation in Days on Market
Properties are staying on the market longer before going under contract. In the City of St. Louis, the median days on market has reached
A Rise in Price Reductions and Concession Negotiations
Sellers who anchored their expectations to peak spring bidding frenzies are meeting resistance from payment-conscious buyers. Approximately
2. What 6.65% Mortgage Rates Mean in Real Dollars
To understand why buyer behavior is evolving, we must examine how a 6.65% interest rate shapes borrowing power. When rates hover in the mid-6% range, the principal and interest (P&I) component of a monthly mortgage payment represents a much larger share of the household budget than it did when rates were lower.
The following table illustrates baseline monthly principal and interest payments across common St. Louis purchase price tiers, assuming a standard 30-year fixed-rate conventional loan with a 20% down payment.
Baseline Principal and Interest Calculations (30-Year Fixed at 6.65%)
| Purchase Price | 20% Down Payment | Total Loan Amount | Est. Monthly Principal & Interest | Total Interest Paid Over 30 Years |
|---|---|---|---|---|
|
$200,000 |
$40,000 |
$160,000 |
$1,027.19 |
$209,789 |
|
$250,000 |
$50,000 |
$200,000 |
$1,283.99 |
$262,237 |
|
$300,000 |
$60,000 |
$240,000 |
$1,540.79 |
$314,684 |
|
$350,000 |
$70,000 |
$280,000 |
$1,797.59 |
$367,131 |
|
$400,000 |
$80,000 |
$320,000 |
$2,054.39 |
$419,578 |
|
$450,000 |
$90,000 |
$360,000 |
$2,311.19 |
$472,026 |
|
$500,000 |
$100,000 |
$400,000 |
$2,567.98 |
$524,473 |
|
$600,000 |
$120,000 |
$480,000 |
$3,081.58 |
$629,368 |
Note: These figures represent pure principal and interest calculations. They do not include local real estate taxes, homeowners insurance, flood insurance, private mortgage insurance (PMI), or Homeowners Association (HOA) dues.
The Real Cost: Why PITI Varies Wildly Across St. Louis
In the St. Louis region, calculating principal and interest alone can lead to severe budgeting errors. Two homes listed at the same $350,000 price point can produce monthly housing costs (Principal, Interest, Taxes, and Insurance — PITI) that differ by $350 to $650 per month depending entirely on their municipal jurisdiction:
| MONTHLY PAYMENT BREAKDOWN ON A $350,000 PURCHASE
20% Down • $280,000 Loan @ 6.65% Fixed
|
|
|---|---|
| Principal & Interest (Fixed) | $1,797.59 / month |
| Scenario A: High-Tax St. Louis County Suburb Example: University City / Webster |
|
|
Real Estate Taxes (~$5,400/yr) |
+$450.00 / month |
|
Hazard Insurance (Older Stock) |
+$175.00 / month |
|
MSD / Municipal Sewer Fees |
+$55.00 / month |
| TOTAL MONTHLY PAYMENT | $2,477.59 / month |
| Scenario B: St. Charles County Suburb Example: O'Fallon / Wentzville |
|
|
Real Estate Taxes (~$3,300/yr) |
+$275.00 / month |
|
Hazard Insurance (Modern Build) |
+$110.00 / month |
|
HOA / Master Community Dues |
+$45.00 / month |
| TOTAL MONTHLY PAYMENT | $2,227.59 / month |
| Scenario C: St. Louis City Historic District Abated vs. Unabated |
|
|
Real Estate Taxes (Unabated Historic ~$3,800/yr) |
+$316.67 / month |
|
Hazard Insurance (Historic Masonry/Slate) |
+$225.00 / month |
|
St. Louis City 1% Earnings Tax (Household $120k/yr) |
+$100.00 / month |
| TOTAL MONTHLY HOUSING & TAX BURDEN | $2,439.26 / month |
-
St. Louis County Municipalities: St. Louis County is divided into dozens of individual municipalities alongside unincorporated areas. Effective property tax rates vary substantially based on school district levies, municipal bond issues, and special business taxing districts. A $350,000 home in a municipality with a high composite tax rate may carry annual property taxes exceeding $5,500 ($458/month), whereas an unincorporated parcel or a lower-rate taxing district might carry $3,200 ($267/month).
-
The City of St. Louis: The City operates as an independent county. Property tax assessments are structured differently, and city residents and workers are subject to a 1.0% earnings tax on gross income. However, select historic districts benefit from tax abatement programs, which can temporarily reduce the tax portion of the escrow payment.
-
St. Charles County: Characterized by lower overall effective property tax rates relative to assessed valuation than parts of central St. Louis County, though newer subdivisions frequently incorporate special assessment districts (such as Community Improvement Districts or Transportation Development Districts) and mandatory HOA fees.
-
Insurance Underwriting in Historic Stock: Properties in historic city neighborhoods (Tower Grove, Soulard, Compton Heights, Lafayette Square) featuring slate roofs, century-old brick masonry, original millwork, and older electrical/plumbing configurations often attract higher annual hazard insurance premiums ($1,800 to $3,000+ per year) compared to modern suburban builds in O'Fallon or Wentzville ($1,100 to $1,600 per year).
3. Analysis of the Most Important August 2026 Data
A comprehensive analysis of current August 2026 data shows three key trends defining the St. Louis metropolitan landscape:
1. The Regional Supply Cushion
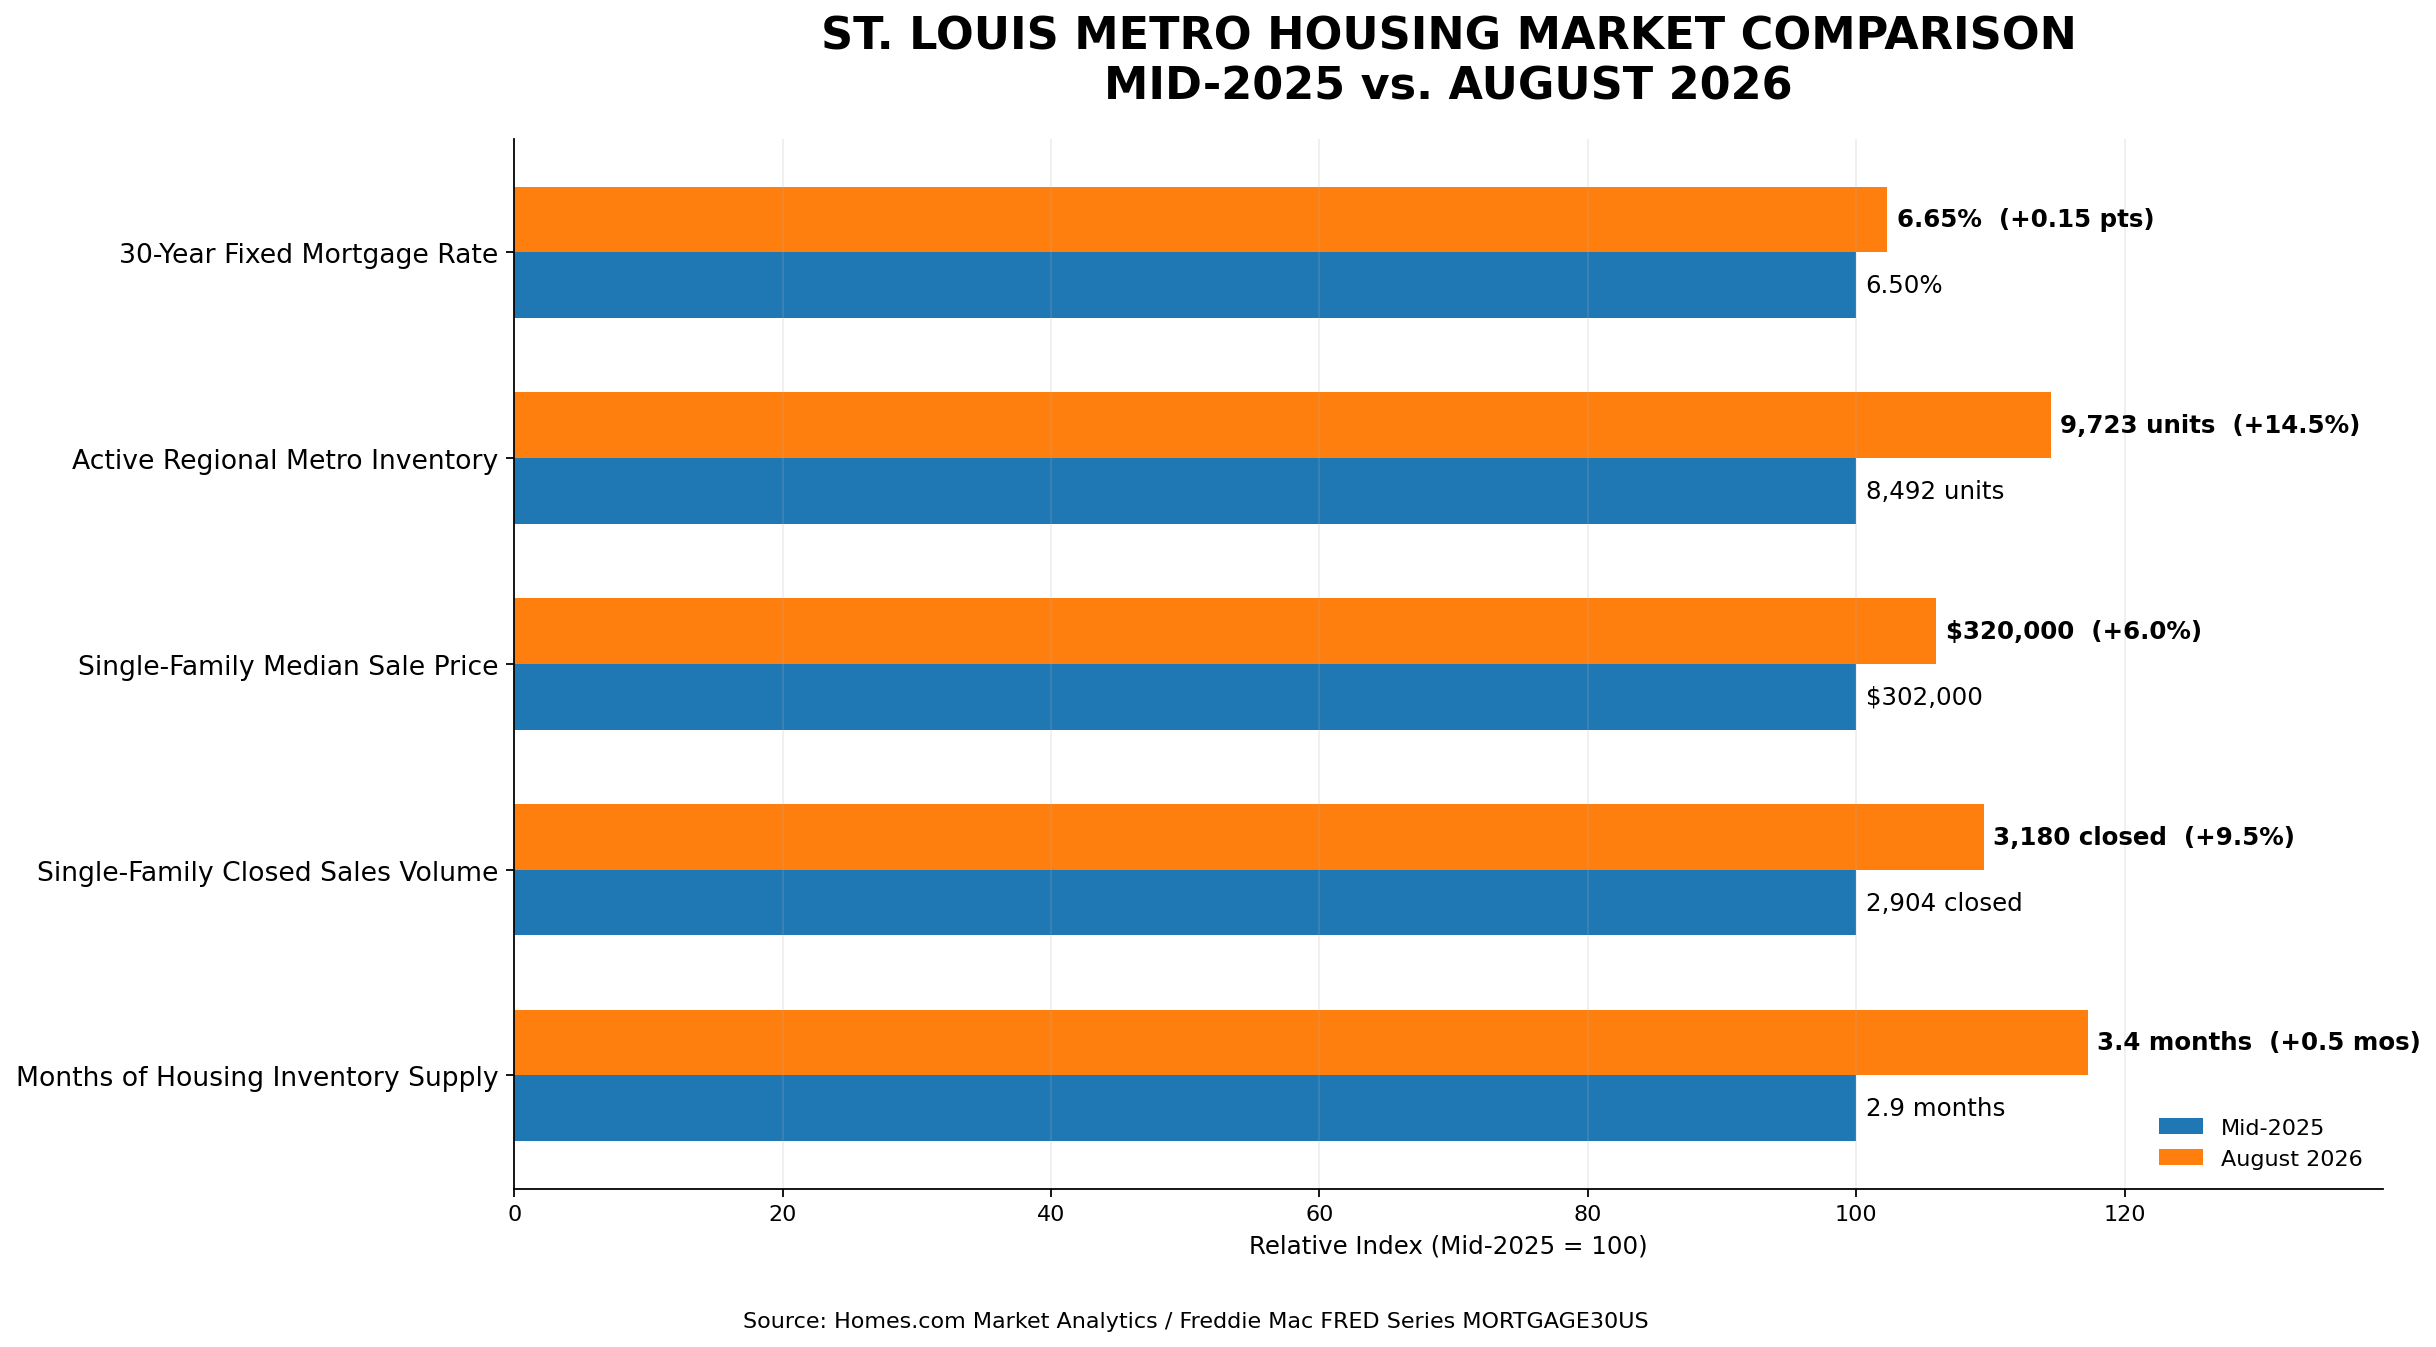
Across the Greater St. Louis CBSA, active inventory expanded to
2. Price Appreciation Moderation
Price growth across the metro area has settled into a sustainable single-digit range. The single-family median sale price across the metropolitan area reached
3. Sales Volume Resilience
Despite mortgage rates remaining above 6.5%, buyer transaction activity has not collapsed. Monthly single-family closed sales across the metro reached
4. Market Trend Visualizations
Visual 1: St. Louis Regional Housing Indicators (Year-Over-Year Comparison)
Visual 2: St. Louis Regional Submarket Performance Snapshot
| Submarket / Indicator | Median Price / Benchmark | YoY Price Change | Median Days on Market | Market Supply / Inventory Context |
|---|---|---|---|---|
|
Greater St. Louis Metro (CBSA) |
+6.0% YoY |
|||
|
St. Louis County |
+5.1% YoY |
18 Days |
~2.6 Months Supply |
|
|
St. Charles County |
+4.96% YoY |
~2.1 Months Supply (Tight) |
||
|
St. Louis City (Urban Core) |
-3.59% YoY |
~3.8 Months Supply (Balanced) |
||
|
St. Louis Condominium Market |
+5.4% YoY |
28 Days |
||
|
St. Louis Townhome Market |
+15.9% YoY |
16 Days |
5. Hyper-Local Submarket Analysis
The St. Louis metropolitan area is a patchwork of independent municipalities, historic urban neighborhoods, mature inner-ring suburbs, and rapidly expanding exurban master-planned developments. Navigating a 6.65% interest rate requires understanding the conditions within each submarket.
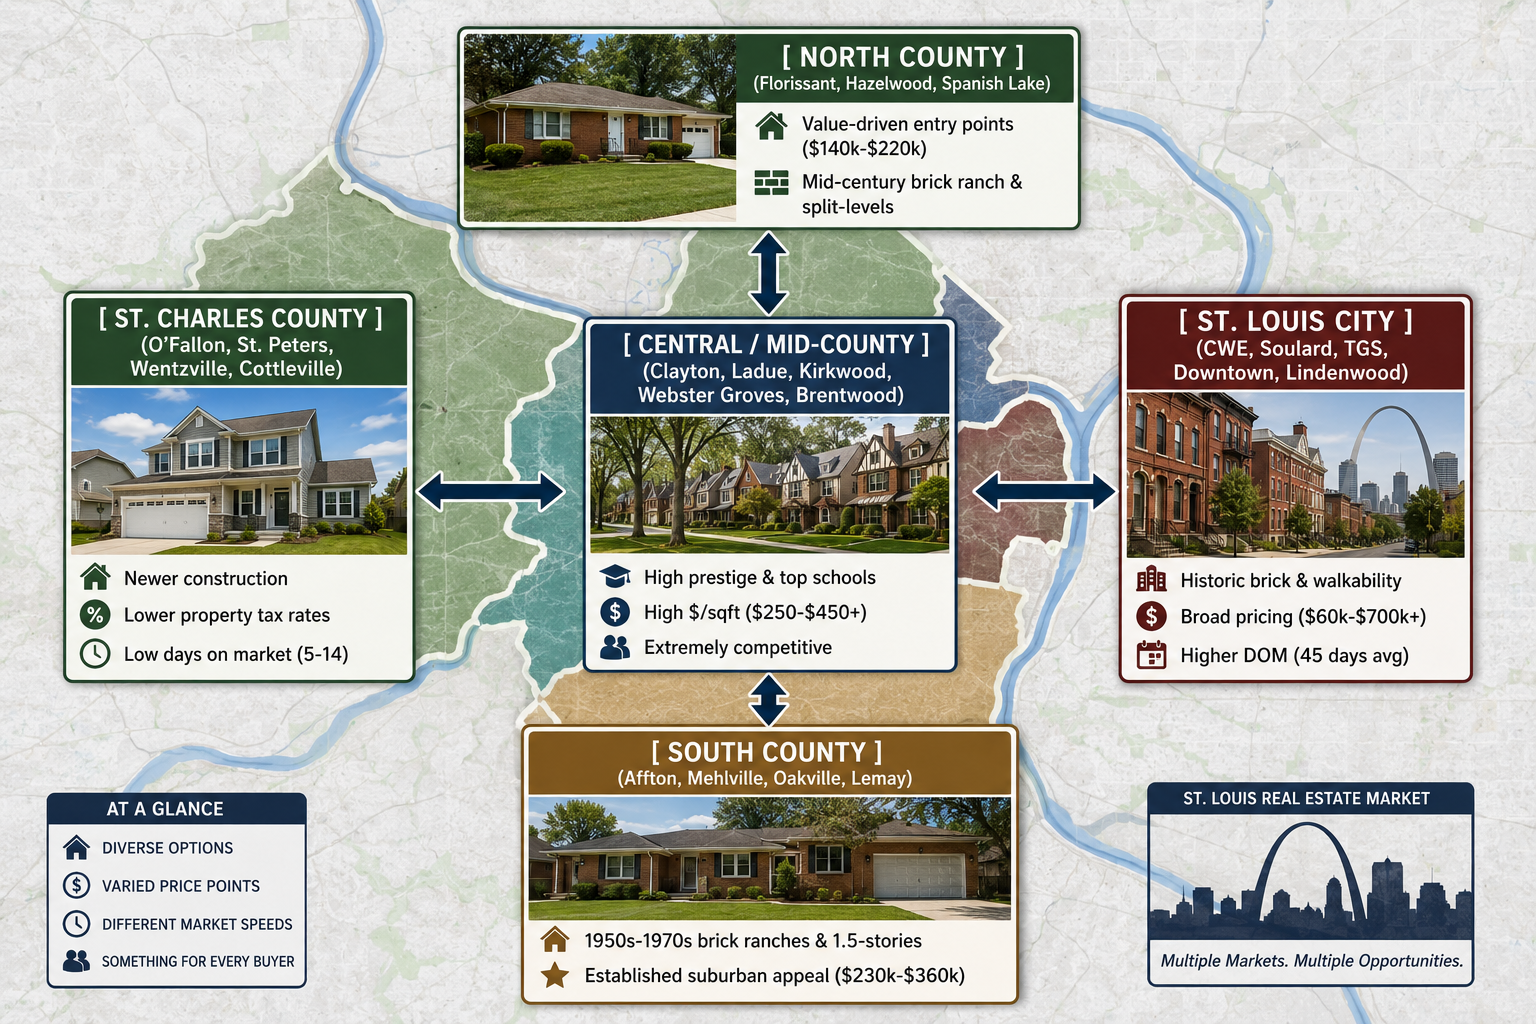
St. Louis City: Historic Architecture and Neighborhood Divergence
The City of St. Louis presents an urban landscape where dynamics change block by block:
-
Central West End (CWE): The city’s premier luxury urban enclave commands a median listing price of
$359,900 with an average price per square foot of $206 -
Soulard and Benton Park: Soulard holds a median listing price of
$407,450 -
Tower Grove South and Tower Grove East: Anchored by Tower Grove Park and the Morgan Ford / Grand commercial corridors, these neighborhoods maintain steady demand for restored brick two-stories and craftsman bungalows. Median listing prices range between
$281,000 in Tower Grove South and $317,400 in Tower Grove East -
Southwest City (Southampton, Lindenwood Park, St. Louis Hills): These neighborhoods remain consistent performers for first-time buyers seeking solid brick masonry housing stock. With median listing prices near
$269,500 in Lindenwood Park -
North City Submarkets (Baden, Penrose, Bellefontaine): Reflecting entry-level acquisition opportunities with median list prices between
$62,000 and $99,900
Central and Mid-St. Louis County: High Demand and School Districts
Communities within Central County represent some of the highest barriers to entry in the Midwest:
-
Clayton, Ladue, and Frontenac: Driven by top-ranked public school districts and regional corporate headquarters, median home values consistently exceed $750,000 to $1,200,000+. At 6.65% interest rates, buyers in these zip codes frequently leverage larger equity down payments (30% to 50%+) from previous home sales to reduce debt service.
-
Kirkwood and Webster Groves: These historic inner-ring suburbs blend pedestrian-friendly downtowns, architectural variety (from historic Victorians to mid-century ranches and modern infill), and strong community identity. Turnkey listings in the $400,000 to $650,000 range still generate multiple offers within 5 to 7 days, though buyers are pushing back against properties with aging roofs or outdated wet basements.
-
Brentwood, Maplewood, and Richmond Heights: Centrally located near major transit corridors (I-64 and I-44), these areas attract young professionals and families seeking suburban school systems with urban accessibility. Median sales hover around $330,000 to $425,000.
North and South St. Louis County: Established Suburban Corridors
-
North County (Florissant, Hazelwood, Spanish Lake): Florissant remains a prominent volume driver for accessible single-family housing in Greater St. Louis. With typical purchase prices ranging from $140,000 to $220,000, North County offers spacious mid-century brick ranches and split-levels. At 6.65% rates, monthly P&I payments here frequently fall between $800 and $1,200, making it one of the most accessible homeownership corridors in the metro area.
-
South County (Affton, Mehlville, Oakville): Affton and Mehlville offer 1950s-1970s housing stock with median prices between $230,000 and $340,000. Further south in Oakville, larger two-story homes and modern subdivisions push median pricing toward $360,000 to $450,000. Properties here maintain low default rates and steady owner-occupancy.
St. Charles County: High-Velocity Suburban Expansion
Crossing the Missouri River along I-64 or I-70 reveals a distinctly different market dynamic:
-
O'Fallon, St. Peters, and Cottleville: The median sold price across St. Charles County sits at
$386,250, reflecting a 4.96% year-over-year increase $425,000 in July 2026 -
Wentzville and Lake St. Louis: Master-planned communities, newer municipal infrastructure, and top-rated Francis Howell and Wentzville school districts continue to attract family relocations.
-
Pace of Sales: Homes in St. Charles County continue to go under contract in a median of just
5 to 14 days 47.2% of homes in St. Charles County sell at or above list price
6. How More Inventory Improves Your Negotiating Position
With regional active listings expanding
CONDITION BENCHMARKING
Tour 4–6 homes simultaneously across varying renovation states.
Calculate actual renovation/repair costs vs. turnkey premiums.
CONTRACT CONCESSION LEVERAGE
- 2-1 Interest Rate Buydown — Seller pays $5k–$9k upfront
- Closing Cost Credits — $3,000–$8,000
- Extended Inspection Resolution Windows — 12–15 days
- Municipal Occupancy Permit Compliance by Seller
EMOTIONAL INSULATION
Eliminates "scarcity panic" and prevents bidding away safety reserves.
1. The Ability to Benchmark Property Condition
In an ultra-low inventory market, buyers are forced to accept whatever is listed. If the only home in your target neighborhood has a 22-year-old roof, an obsolete electrical panel, and settling concrete, you either buy it or abandon your search.
With more inventory, you can evaluate 3 to 5 properties in the same submarket simultaneously. You can contrast a $340,000 home requiring $30,000 in deferred maintenance against a $365,000 home with an updated architectural shingle roof, dual-zone HVAC, and updated copper plumbing. When you can quantify the true cost of repairs, you can make disciplined offers based on net value.
2. Concrete Contract Concessions
When sellers face competition from other active listings in their subdivision, they become far more receptive to contract terms that lower the buyer's out-of-pocket expenses:
-
Seller-Paid Interest Rate Buydowns (2-1 Buydown): On a $300,000 loan, a 2-1 buydown lowers the buyer’s effective note rate to 4.65% in Year 1 and 5.65% in Year 2, before returning to the permanent 6.65% rate in Year 3. The cost to the seller (typically around $6,500 to $7,500) saves the buyer roughly $380/month in their critical first year of homeownership—providing cash-flow relief during move-in and initial decorating.
-
Closing Cost Assistance: Rather than asking for a $10,000 price cut (which reduces a monthly payment at 6.65% by only ~$64/month), asking for a $10,000 seller credit directly covers loan origination fees, title insurance, transfer fees, and initial escrow funding—preserving $10,000 in cash reserves in the buyer’s bank account.
-
Municipal Occupancy Compliance: St. Louis County and City municipalities strictly enforce occupancy inspections before deed transfer. In today’s market, buyers can insist that sellers correct all code violations, repair broken window seals, install required GFCI outlets, and clear sewer lines before closing.
3. Protection Against Overbidding and Contingency Waivers
When inventory is scarce, fear of missing out drives buyers to waive appraisal and inspection contingencies. In the current August 2026 environment,
7. Mathematical Case Studies: Price Cuts vs. Rate Buydowns vs. Closing Credits
To illustrate how St. Louis home buyers should structure offers in an elevated interest-rate environment, let's examine three realistic offer scenarios on a typical $350,000 listing in St. Louis County that has been on the market for 28 days.
Assume the buyer has a 10% down payment ($35,000) and is securing a $315,000 conventional loan at a 6.65% 30-year fixed rate.
Scenario Comparison: Evaluating a $10,000 Seller Concession
| METRIC | OPTION A $10k Price Cut |
OPTION B $10k Seller Credit |
OPTION C 2-1 Buydown |
|---|---|---|---|
|
Agreed Purchase Price |
$340,000 |
$350,000 |
$350,000 |
|
Down Payment (10%) |
$34,000 |
$35,000 |
$35,000 |
|
Loan Amount |
$306,000 |
$315,000 |
$315,000 |
|
Effective Year 1 Rate |
6.65% |
6.65% |
4.65% (-2.00%) |
|
Year 1 Monthly P&I |
$1,964.50 |
$2,022.28 |
$1,625.32 |
|
Year 1 Monthly Savings |
$57.78 / month |
$0.00 / month |
$396.96 / month |
|
Effective Year 2 Rate |
6.65% |
6.65% |
5.65% (-1.00%) |
|
Year 2 Monthly P&I |
$1,964.50 |
$2,022.28 |
$1,817.47 |
|
Year 2 Monthly Savings |
$57.78 / month |
$0.00 / month |
$204.81 / month |
|
Cash Required at Closing |
~$46,000 |
~$36,000 (-$10k Credit) |
~$46,000 (Funded by Seller) |
| TOTAL 2-YEAR CASH BENEFIT | $1,386.72 | $10,000 Immediate Cash |
$7,221.24 Cash Flow |
Strategic Takeaways from the Math:
-
Why a simple price cut is least effective for monthly cash flow: Cutting the price from $350,000 to $340,000 saves the buyer just $57.78 per month. While it reduces the purchase price on paper, it does almost nothing to ease monthly payment strain.
-
Why closing credits protect liquidity: A $10,000 seller credit used for standard closing costs reduces out-of-pocket cash needs by $10,000 on day one. This keeps funds in the buyer's emergency savings account to handle immediate home improvements, tree trimming, or unexpected HVAC repairs.
-
Why the 2-1 buydown offers the best transitional cash flow: A temporary buydown funded by the seller lowers the buyer's monthly mortgage payment by nearly $400/month during the first year and over $200/month in the second year, providing critical financial breathing room while adjusting to homeownership expenses.
8. Should You Buy Now or Wait for Lower Rates?
The question facing many prospective homeowners in the St. Louis area is straightforward: "Should I buy now at 6.65%, or wait for rates to drop to 5.5% or 5.0%?"
While waiting is entirely appropriate if current monthly payments strain your debt-to-income ratio or deplete your savings, attempting to time the interest-rate cycle carries distinct trade-offs.
|
SCENARIO A
BUY TODAY @ 6.65%
Purchase Price: $320,000 Down Payment (20%): $64,000 Loan Amount: $256,000 Monthly P&I: $1,643.51 Competition: 1–2 Offers Concessions: Inspection Credits |
SCENARIO B
WAIT FOR 5.50%
Purchase Price: $345,000 (+7.8%) Down Payment (20%): $69,000 (+$5k) Loan Amount: $276,000 Monthly P&I: $1,567.11 Competition: 5–8 Offers (Competitive Bidding) Concessions: Contingencies Waived |
NET MONTHLY DIFFERENCE: ~$76/mo savings by waiting, BUT requires: - $5,000 more upfront down payment cash - Absorbing competitive bidding wars and appraisal gap guarantees
The Mechanism of Pent-Up Buyer Demand
St. Louis remains an affordable market relative to national averages (with single-family homes at
The Decision Test
A structured way to evaluate the decision is:
The 3-Part Affordability Rule:
- Can you comfortably afford the all-in monthly payment (PITI + Maintenance) at 6.65% using current household income alone?
- Will you retain an emergency reserve of at least 3 to 6 months of living expenses after paying the down payment and closing costs?
- Do you plan to own the property for at least 5 to 7 years, allowing time for equity accumulation and amortization?
If the answer to all three questions is Yes, buying now allows you to negotiate price and terms calmly. If rates drop in the future, refinancing remains an option; if rates remain near 6.65%, your housing costs are already locked in and budgeted safely. If the answer depends entirely on an assumed refinance within 12 months to avoid financial distress, the purchase carries too much risk.
9. St. Louis Property Inspection Realities: Older Brick, Foundations, and Clay Laterals
Buying a home in the St. Louis metropolitan area requires specific due diligence. St. Louis boasts some of the finest historic brick architecture and sturdy mid-century housing stock in North America, but these aging structures require focused physical inspections.
THE CRITICAL ST. LOUIS HOME INSPECTION PROTOCOL
01SEWER LATERAL SCOPE Clay Pipe vs. Cast Iron vs. PVC
|
02FOUNDATION & STRUCTURAL INTEGRITY
|
03ELECTRICAL PANELS & WIRING
|
04ROOFING, MASONRY TUCKPOINTING & PARAPET WALLS
|
05MUNICIPAL OCCUPANCY PERMIT COMPLIANCE
|
The Sewer Lateral Line
Many homes built before 1975 throughout St. Louis City, University City, Affton, and Florissant utilize vitrified clay-tile sewer lateral lines connecting the home's plumbing stack to the Metropolitan St. Louis Sewer District (MSD) main line under the street. Over decades, mature oak and maple root systems penetrate clay pipe joints, causing recurring sewage backups or collapsed lines.
A standard home inspection does not include a sewer scope. Buyers must schedule a separate sewer lateral camera inspection ($150 to $250). If repairs are required (which can cost $4,000 to $10,000+ if street excavation is needed), many St. Louis municipalities manage a Sewer Lateral Repair Program that pays a significant portion (often 50% to 85%) of qualifying repair costs, provided the proper municipal application is submitted before closing.
Foundation Settling and Soil Mechanics
Much of Greater St. Louis rests on clay-rich soil formations that swell during wet spring months and shrink during hot, dry summer periods. This cyclic movement causes hydrostatic pressure against foundation walls:
-
Limestone Foundations (Homes built before 1930): Common in St. Louis City, Kirkwood, and Webster Groves. Soft lime-based mortar naturally erodes over time. Buyers should inspect for crumbling mortar, interior water seepage, and efflorescence. Tuckpointing limestone foundations with modern hard Portland cement can trap moisture and crack stones; proper historic lime mortar must be used.
-
Poured Concrete Foundations (Homes built 1950–Present): Common across South County, North County, and St. Charles County. Vertical hairline shrinkage cracks are typical, but horizontal cracks or stair-step cracks exceeding 1/4-inch indicate lateral earth pressure and may require carbon-fiber strapping or steel I-beam stabilization ($4,000 to $9,000).
Electrical Infrastructure
When touring St. Louis homes built before 1940, inspect the main electrical panel:
-
Knob-and-Tube Wiring: Uninsulated, early-generation electrical wiring found in unrenovated historic homes. Most standard insurance underwriters will not issue hazard insurance policies until active knob-and-tube wiring is decommissioned and replaced with modern Romex wiring ($6,000 to $15,000+).
-
Obsolete Electrical Panels: Federal Pacific Electric (FPE) Stab-Lok and Zinsco breaker panels installed between 1950 and 1980 represent known fire risks. Buyers should request a seller replacement or an electrical credit of $1,500 to $2,500.
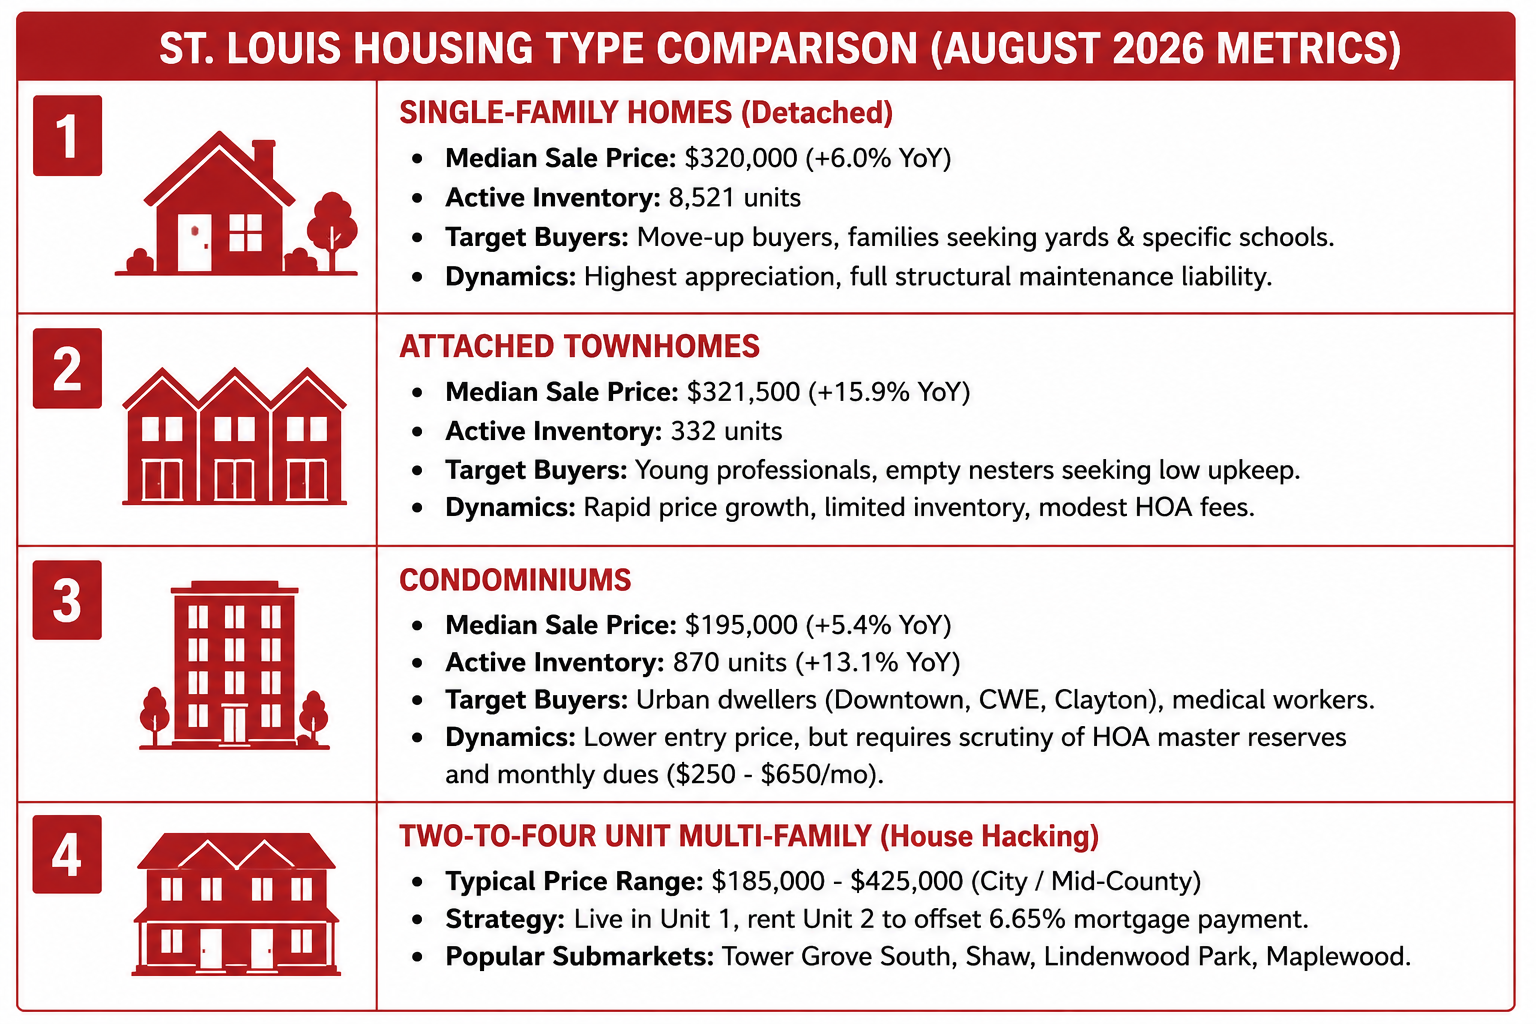
10. Local Affordability by Property Type: Detached vs. Condos vs. Multi-Family
The St. Louis real estate market offers diverse property structures for different buyer lifestyles and investment strategies.
The Condominium Segment
Condominiums represent an entry point into high-prestige zip codes. With a regional median sold price of
However, buyers must review the condominium association’s financial health:
-
Reserve Studies: Does the HOA maintain adequate reserve funds to replace roofs, repair exterior masonry, and maintain elevators?
-
Special Assessments: Are there pending capital assessments for building repairs?
-
Insurance Master Policies: Has the HOA's master casualty policy premium spiked, and will that increase monthly condo fees?
-
Warrantability: Ensure the condominium complex meets Fannie Mae and Freddie Mac lending standards (e.g., owner-occupancy ratios, commercial space limits) to avoid non-warrantable financing fees.
House Hacking St. Louis Multi-Family Properties
For buyers challenged by 6.65% interest rates, purchasing a classic St. Louis two-family or four-family brick flat presents an effective affordability strategy.
By purchasing a two-family property in neighborhoods like Tower Grove South, Shaw, North Hampton, or Maplewood for $325,000:
-
Total Monthly PITI Payment: ~$2,450 / month
-
Rental Income from Second Unit: ~$1,250 to $1,450 / month
-
Net Effective Housing Outlay: $1,000 to $1,200 / month
This approach provides entry-level homeownership in prime urban locations while generating rental cash flow to offset higher borrowing costs.
11. Practical Takeaways for Buyers, Sellers, and Investors
Understanding the August 2026 data translates into specific strategic actions for each participant in the St. Louis real estate market.
| STAKEHOLDER STRATEGY MATRIX (AUGUST 2026) | ||
|---|---|---|
FOR BUYERS✓ Prioritize total monthly payment (PITI + Municipal Taxes + Insurance). ✓ Target listings with 20+ DOM for seller-paid 2-1 interest rate buydowns. ✓ Perform dedicated sewer lateral scopes and foundation inspections. ✓ Retain a 3-to-6-month liquid cash cushion post-closing. |
FOR SELLERS✓ Price accurately from Day 1; avoid anchoring to peak spring comps. ✓ Pre-inspect sewer laterals and address municipal occupancy requirements. ✓ Offer proactive buyer closing-cost credits to widen the qualified buyer pool. ✓ Highlight updated mechanical systems (HVAC, Roof, Windows) in marketing. |
FOR INVESTORS✓ Target underperforming 2-to-4 unit brick multi-families in South City. ✓ Underwrite debt service strictly at current 6.65%–7.25% investor rates. ✓ Focus on value-add renovation margins rather than rapid price appreciation. ✓ Verify municipal occupancy licensing and rental inspection rules. |
Guidance for St. Louis Home Buyers
-
Shop with Payment Discipline: Establish your payment ceiling with your lender before setting foot in a property. Do not allow emotional attachment to push you beyond your monthly budget.
-
Target Stale Listings: Search specifically for properties that have been on the market for 21 days or longer, or those that have completed a price reduction. Sellers on these properties are often motivated and open to contributing $5,000 to $10,000 toward buyer closing costs or rate buydowns.
-
Protect Your Cash Reserves: Do not allocate all available liquid cash to your down payment. Retain a reserve for post-closing expenses, municipal permit requirements, and maintenance.
Guidance for St. Louis Home Sellers
-
Avoid Overpricing at Launch: In an environment where regional supply has grown
14.5% year-over-year 32% of active homes have reduced their asking prices -
Pre-Empt Inspection Hurdles: Complete your municipal occupancy inspection and commission a sewer camera scope before listing. Addressing small repairs, replacing cracked window glass, installing GFCI outlets, and clearing sewer lines prevents transactions from stalling during the buyer's inspection window.
-
Consider Offering Buyer Concessions Upfront: Advertising a "$5,000 Seller Credit Toward Buyer Rate Buydown or Closing Costs" in MLS remarks can make your listing stand out to payment-sensitive buyers.
Guidance for St. Louis Real Estate Investors
-
Underwrite for Cash Flow at Current Debt Costs: Build financial models based on prevailing interest rates rather than speculative future refinancing. Ensure cash flow covers conservative vacancy allowances (6% to 8%) and maintenance reserves (10% to 12%).
-
Focus on Solid Class B/C+ Neighborhoods: Established rental corridors in Florissant, Hazelwood, Affton, Mehlville, Lindenwood Park, and Tower Grove South continue to show steady tenant demand, supported by the region's diverse employment base across healthcare (BJC, SSM, Mercy), aerospace/defense (Boeing), agriculture/biotech (Bayer), and higher education (Washington University, Saint Louis University).
12. Complete St. Louis Metro Data Table
The following table provides a reference of key housing metrics across the primary counties, municipalities, and product types within the St. Louis metropolitan area.
| Geographic Area / Asset Class | Median Price Benchmark | YoY Price Trajectory | Median Days on Market | Active Listing Volume | Market Supply Phase |
|---|---|---|---|---|---|
|
Greater St. Louis MSA (Total) |
+6.0% YoY |
Balanced (3.4 Mo Supply) |
|||
|
St. Louis County (All) |
+5.1% YoY |
18 Days |
~4,850 Listings |
Moderate Seller Advantage |
|
|
St. Charles County (All) |
+4.96% YoY |
~1,620 Listings |
Tight Seller Advantage |
||
|
St. Louis City (All Wards) |
-3.59% YoY |
~1,850 Listings |
Balanced / Buyer Opportunity |
||
|
Central West End (City) |
+2.1% YoY |
38 Days |
Active Micro-Hub |
Balanced Urban Luxury |
|
|
Soulard / Benton Park (City) |
+3.8% YoY |
46 Days |
Stable Historic Stock |
Balanced Historic Market |
|
|
Tower Grove South (City) |
+4.2% YoY |
28 Days |
High Renovation Demand |
Moderate Seller Advantage |
|
|
Lindenwood Park (City) |
+5.0% YoY |
24 Days |
Fast Brick Stock |
Steady Demand |
|
|
Florissant / North County |
$175,000 (Median Sold) |
+4.1% YoY |
21 Days |
~680 Listings |
Value Entry Corridor |
|
Kirkwood / Webster Groves |
$485,000 (Median Sold) |
+6.8% YoY |
9–14 Days |
~210 Listings |
Competitive Inner-Ring |
|
O'Fallon / Wentzville |
$395,000 (Median Sold) |
+5.3% YoY |
11 Days |
~740 Listings |
Rapid Suburban Expansion |
|
Metro Condominiums |
+5.4% YoY |
28 Days |
Balanced Urban/Suburban |
||
|
Metro Attached Townhomes |
+15.9% YoY |
16 Days |
High Demand / Low Supply |
13. A Step-by-Step St. Louis Home Buyer Execution Roadmap
Navigating the transition from house hunter to homeowner in late August 2026 requires methodical preparation. Follow this roadmap to structure your home search:
| ST. LOUIS HOME BUYER ROADMAP |
|---|
| PHASE 1: FINANCIAL QUALIFICATION & TAX MAPPING |
| PHASE 2: TARGETED PROPERTY SCREENING |
| PHASE 3: STRATEGIC OFFER STRUCTURING |
| PHASE 4: DUE DILIGENCE & INSPECTION EXECUTION |
| PHASE 5: LOAN FINALIZATION & SETTLEMENT |
Phase 1: Financial Qualification and Tax Mapping
-
Get Underwriter-Verified Pre-Approval: Move beyond a simple online pre-qualification. Work with a lender who verifies pay stubs, W-2s, tax returns, and bank statements upfront so your financing is secure when making an offer.
-
Map Composite Tax Rates: Work with your buyer's agent to look up actual composite millage rates and assessed values for every target home. Do not rely on estimates from listing portals.
Phase 2: Targeted Property Screening
-
Filter for Days on Market: Focus your weekly search alerts on listings that have reached 14 to 30 days on market. These listings offer the best opportunities to negotiate concessions without facing competing offers.
-
Check Systems Age: Have your agent pull the Seller’s Property Disclosure Statement before touring to check the age of the roof, furnace, air conditioning condenser, and water heater.
Phase 3: Strategic Offer Structuring
-
Request the Right Concession: On homes that have sat on the market, request a 2% to 3% seller credit toward a 2-1 temporary interest rate buydown or closing costs rather than relying solely on a purchase price reduction.
-
Protect Your Contract Contingencies: Keep standard 10-to-15-day inspection resolution windows and standard appraisal contingencies intact.
Phase 4: Due Diligence and Specialized Inspections
-
Schedule Specialized Inspections Immediately: In addition to the standard building inspector, schedule a specialized sewer lateral camera scope and an HVAC technician if the equipment is over 15 years old.
-
Review Municipal Occupancy Reports: Obtain the municipal occupancy inspection report directly from the local city hall to confirm what repairs are required before you take possession.
Phase 5: Loan Finalization and Settlement
-
Final Walkthrough Verification: Ensure that all negotiated repairs were completed by licensed contractors and that receipts and permits are provided before signing final closing documents.
-
Maintain Your Cash Reserve: Verify that your post-closing bank balance retains 3 to 6 months of living expenses for long-term financial security.
Conclusion:
Navigating the St. Louis housing market with mortgage rates near 6.65% requires shifting your focus from chasing peak-market frenzy to executing disciplined, math-driven decisions. The modest easing of borrowing costs alongside an active inventory expansion of
Whether you are targeting historic brick architecture in South City, established school districts in Central County, or newer builds in St. Charles County, total monthly payment and property condition should guide every step of your search. By prioritizing seller concessions like 2-1 buydowns or closing cost credits over simple price reductions, protecting your inspection rights for aging infrastructure, and keeping a 3-to-6-month cash reserve intact, you position yourself to build sustainable equity across the Gateway City—regardless of where interest rates head next.
Ready to Buy or Sell in St. Louis? House Sold Easy Has You Covered!
Whether you're thinking about listing your home or exploring a cash offer, it's worth understanding all of your options before making a decision. The right choice depends on your timeline, your property's condition, and your goals. Contact House Sold Easy to discuss your situation and see what makes the most sense for you.Our St. Louis experts know every corner of this city and will make buying your dream home or selling your high-end property a breeze. Don’t miss out on the hottest market in the U.S.! Contact House Sold Easy today and let’s make your real estate goals happen!